Download

1 / 6
60 likes | 74 Views
This report covers the period from 2000 to 2017, highlighting improvements in healthcare access and quality, with particular emphasis on disparities among various racial and socioeconomic groups. It reveals both progress and persistent challenges in access to care and quality of services. The data presented helps in understanding the evolving landscape of healthcare delivery and identifying areas that require attention for better outcomes.

E N D
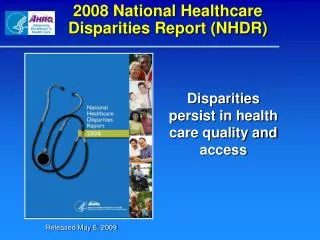
2018 National HealthcareQuality and Disparities Report • Executive Summary
Access to Care • From 2000 to 2017: • More than half of access measures showed improvement: • For example, there were significant gains in the percentage of people who reported having health insurance. • One-third of access measures did not show improvement. • Fourteen percent showed worsening.
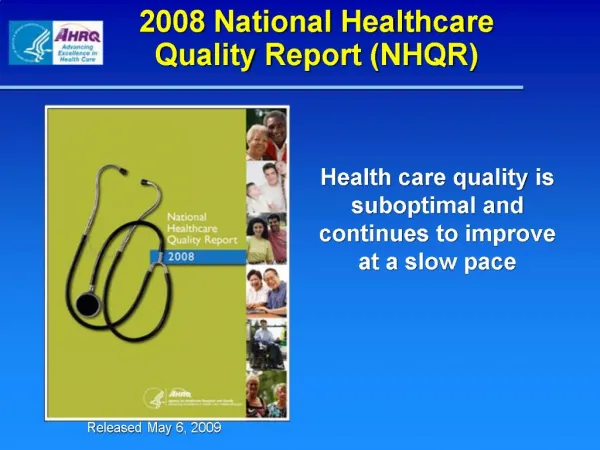
Quality • Quality of healthcare improved overall from 2000 through 2016-2017, but the pace of improvement varied by priority area: • Person-Centered Care: Almost 70% of measures were improving. • Patient Safety: More than 60% of measures were improving. • Healthy Living: Almost 60% of measures were improving. • Effective Treatment: Almost half of measures were improving. • Care Coordination: One-third of measures were improving. • Care Affordability: No care affordability measures changed.
Disparities • Some disparities were getting smaller from 2000 through 2016-2017, but disparities persist, especially for poor and uninsured populations in all priority areas. • Racial and ethnic disparities vary by group: • Blacks, American Indians and Alaska Natives (AI/ANs), and Native Hawaiians/Pacific Islanders (NHPIs) received worse care than Whites for about 40% of quality measures. • Disparities were improving for only 4 measures for Blacks, 2 measures for AI/ANs, and 1 measure for NHPIs.
Disparities (cont’d.) • Racial and ethnic disparities vary by group: • Hispanics received worse care than Whites for about 35% of quality measures. • From 2000 to 2017, disparities were improving for 5 measures for Hispanics. • Asians received worse care than Whites for 27% of quality measures but better care than Whites for 28% of quality measures. • Disparities were improving for only 2 measures for Asians.
Report Background • Mandated by Congress to provide a comprehensive overview of the quality of healthcare received by the general U.S. population and disparities in care experienced by different racial and socioeconomic groups. • More than 250 measures that span structure, process, and outcome measures for which existing national data sources can be used. • Supported by a U.S. Department of Health and Human Services Interagency Work Group.