Download
1 / 69
690 likes | 820 Views
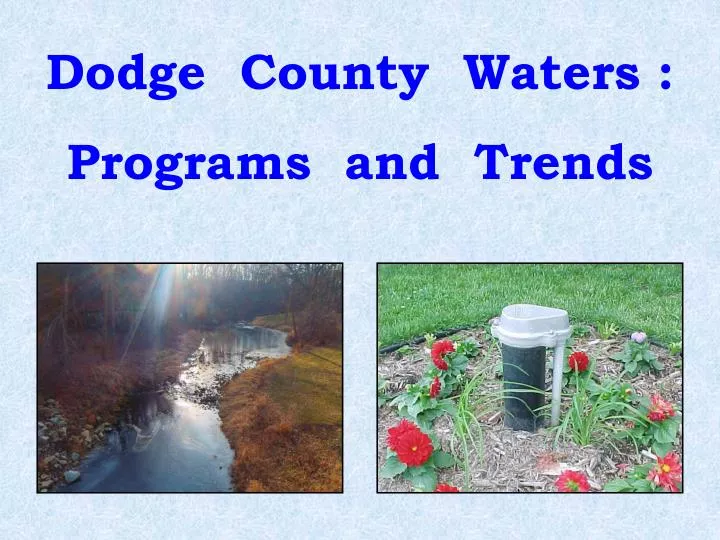
Dodge County Waters : Programs and Trends. What is the quality of the ground water and surface water in Dodge County ? Is the quality improving or worsening?.

E N D
What is the quality of the ground water and surface water in Dodge County ? Is the quality improving or worsening? Water monitoring efforts over the last 12 years have provided some answers and raised additional questions, as well. Changing environmental conditions, and high public interest, provide the impetus to continue to gather and learn from accurate water quality data. All activities & projects contained in this presentation are in support of directives set forth in the Dodge County Comprehensive Water Management Plan.
In Dodge County, Ground Water is #1 !!!! The Dodge County Comprehensive Water Management Plan clearly states that groundwater protection takes priority over surface water protection. Our ground water management plan revolves around: ASSESSMENT - PROTECTION - EDUCATION
DODGE COUNTY WATER ISSUES GROUND WATER SURFACE WATER • Nitrate • Bacteria • Lead • Arsenic • Pesticides • Nitrate • Sediment • Bacteria • Stream Flow • Phosphorous
To better understand ground water, it’s important to visualize the rock layers, most of which serve as drinking water aquifers, which exist under Dodge County, moving from deepest to shallowest.
Let’s cut through the rock layers and expose them from a side view.
Ellington Concord Milton WEST EAST 1300 1300 Elevation Above Sea Level (ft) 1200 1200 SOIL, SAND & GRAVEL GALENA LIMESTONE 1100 1100 DECORAH SHALE 1000 1000 ST. PETER SANDSTONE 900 900 PRAIRIE DU CHIEN DOLOMITE/SANDSTONE 0 1 2 3 4 5 6 Miles Generalized Geographic Formations Underlying Ellington, Concord and Milton Townships Subsurface Geologic Cross-Section In general, the thicker soils in the western portion of the county provide more protection from surface contaminants reaching the rock layers.
Ellington Concord Milton WEST EAST 1300 Shallow Well, < 50 Ft. to Bedrock 1300 1200 1200 SOIL, SAND & GRAVEL Elevation Above Sea Level (ft) GALENA LIMESTONE 1100 ~60% of all wells 1100 DECORAH SHALE 1000 1000 ST. PETER SANDSTONE ~15% of all wells 900 900 PRAIRIE DU CHIEN DOLOMITE/SANDSTONE ~ 10% of all wells 0 1 2 3 4 5 6 Miles Deep river valleys in the eastern portion of the county can erode the protective shale layer, exposing the layers below to contamination. Subsurface Geologic Cross-Section Generalized Geographic Formations Underlying Ellington, Concord and Milton Townships
Claremont Wasioja Mantorville EAST WEST Elevation Above Sea Level (ft) 1300 1300 SOIL, SAND & GRAVEL 1200 1200 1100 1100 GALENA LIMESTONE 1000 1000 DECORAH SHALE 900 900 ST. PETER SANDSTONE PRAIRIE DU CHIEN DOLOMITE/SANDSTONE 0 1 2 3 4 5 6 Miles Subsurface Geologic Cross-Section Generalized Geographic Formations Underlying Ellington, Concord and Milton Townships
Ripley Ashland Canisteo WEST EAST Elevation Above Sea Level (ft) 1300 1300 SOIL, SAND & GRAVEL 1200 1200 1100 1100 GALENA LIMESTONE 1000 1000 900 900 DECORAH SHALE ST. PETER SANDSTONE PDC Subsurface Geologic Cross-Section Generalized Geographic Formations Underlying Ellington, Concord and Milton Townships
WEST Westfield Hayfield Vernon EAST Elevation Above Sea Level (ft) 1300 1300 SOIL, SAND & GRAVEL 1200 1200 CEDAR VALLEY-MAQUOKETA LIMESTONE 1100 1100 1000 1000 GALENA LIMESTONE 900 900 DECORAH SHALE ST. PETER SANDSTONE PDC 0 1 2 3 4 5 6 Miles Subsurface Geologic Cross-Section Generalized Geographic Formations Underlying Ellington, Concord and Milton Townships
Nitrate’s Pathway to Surface and Ground Water Nitrogen Fertilizer Applied Run Off to Surface Water Nitrate Attaches to Water, Then Moves to Ground Water Nitrate Utilized by Plant in Root Zone Nitrate Moves into Field Tile, Then to Surface Water
High nitrate wells occur most frequently in the Highly Sensitive Groundwater Area, where depth-to-bedrock is less than 50 ft, or where underground sand lenses exist.
Nitrate levels > 1 mg/l in the St. Peter Sandstone are a reason for concern.
Areas of Dodge County where the St. Peter Sandstone is shallow and vulnerable to surface contamination.
Ground Water Projects: Dodge County Volunteer Nitrate Monitoring Network • A grant-funded network operating across SE MN since 2007. • Approximately 100 private well owners participate in Dodge • County, sampling their wells every 6 months. • The Dodge County network is sub-divided into one baseline, and • three targeted, groups. The targeted groups are: • Wells monitoring areas near • known high-nitrate wells. • 2) Wells monitoring areas near • existing sinkholes. • 3) Wells monitoring the region • along the Decorah Edge.
Decorah Edge Diagram Wells near the Decorah Edge can sometimes be affected by nitrate as it wicks around the shale and is drawn back toward the well. Galena Limestone Ground water with high nitrate conc. Water Well Plant Uptake Decorah Shale Ground waters with lower nitrate conc. Platteville Limestone Glenwood Shale Nitrates may enter well water St. Peter Sandstone Aquifers are Recharged
Volunteer Nitrate Monitoring Network Results MN Dept. of Health Drinking Water Limit = 10 mg/l 0 – 1 mg/l is considered back- ground level Nitrate Level (mg/l) The recent upward trend in nitrate level may be due , in part, to recent near-drought conditions, which tend to concentrate nitrate in the drinking water aquifers.
Future Ground Water Efforts: • Continue to locate and map new wells and those with known depth. • Make inexpensive well test kits available for untested wells at risk of high nitrate levels. • Maintain recent groundwater information on the Dodge County website. • Continue to develop nitrate trends through the Volunteer Nitrate Monitoring Network.
Surface Water Programs & Projects: • - Deal with pollution prevention • and corrective measures. • - Focus on: -Nutrients • - Sediment • - Stream Flow Our surface water management plan revolves around: ASSESSMENT - PREVENTION - EDUCATION
TRANSPARENCY TUBE THE PRIMARY TOOL USED IN THE VOLUNTEER CITIZEN STREAM MONITORING PROGRAM 60 cm Tube (Used for the last 15 yrs) 100 cm Tube (Used Now)
Tube Transparency & Rainfall Trends 5000 Samples !!! Tube Transparency (cm) & Annual Rainfall (in) Monitoring Year
Trendline Sample of the Index of Biotic Integrity (IBI) results generated by examining and sorting the macroinvertebrates (bugs) gathered from each stream site. Upward trend lines indicate an improving stream environment for living organisms.
Cedar River Grade: B- Sub-Watershed Report Cards* * Based on transparency tube readings, insect populations, and other factors. • Factors include sub-watershed size, • land use, historical data, and • soil characteristics.
South Fork Zumbro Grade: C- Trendline
Salem Creek Grade: B+ Trendline
Dodge Center Creek Grade: B
Masten Creek Grade: B+ Trendline
South Branch Middle Fork Zumbro Grade: C-
Milliken Creek Grade: C+
Harkcom Creek Grade: D+
Middle Fork Zumbro Grade: A- Trendline