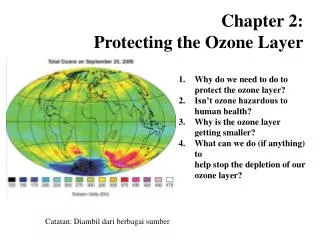
5-2. ozone layer
5-2. ozone layer. 5-1-1. Formation of Ozone Layer Ozone layer: A part of stratosphere (ca. 20km high) in which ozone concentration is relatively high The formation reactions O 2 + ℎν uv (<240nm) → 2O (R1) O + O 2 + M ↔ O 3 + M (R2) O 3 + ℎν uv → O 2 + O (R3) used in (R2) again

5-2. ozone layer
E N D
Presentation Transcript
5-2. ozone layer • 5-1-1. Formation of Ozone Layer • Ozone layer: A part of stratosphere (ca. 20km high) in which ozone concentration is relatively high • The formation reactions • O2+ ℎνuv(<240nm) → 2O (R1) O + O2+ M ↔ O3 + M (R2) • O3+ ℎνuv→ O2 + O (R3) used in (R2) again • O3+ O → 2O2 (R4)(Destruction of ozone) • Reaction (R4) can be catalyzed by OH, NO radical, and halogens (Br, Cl)
Levels of ozone at various altitudes and blocking of different bands of ultraviolet radiation. Essentially all UVC (100–280 nm) is blocked by dioxygen (from 100–200 nm) or else by ozone (200–280 nm) in the atmosphere. The shorter portion of the UV-C band and the more energetic UV above this band causes the formation of the ozone layer, when single oxygen atoms produced by UV photolysis of dioxygen (below 240 nm) react with more dioxygen. The ozone layer also blocks most, but not quite all, of the sunburn-producing UV-B (280–315 nm) band, which lies in the wavelengths longer than UV-C. The band of UV closest to visible light, UV-A (315–400 nm), is hardly affected by ozone, and most of it reaches the ground. UV-A does not cause skin reddening, but there is evidence that it causes long-term skin damage
Ozone-oxygen cycle in the ozone layer http://en.wikipedia.org/wiki/Ozone_layer
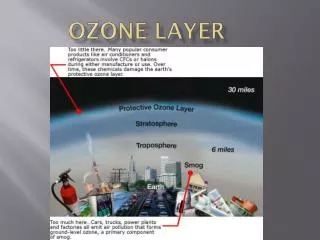
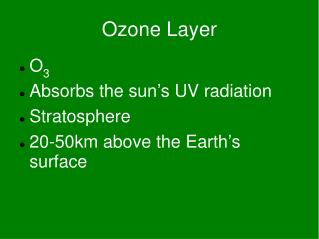
5-2-2. Roles of Ozone Layer • Solar radiation: Infrared 50%, Visible 40%, Ultraviolet 10% • UV (Ultraviolet) • Extreme UV: l=10-121 nm – extremly harmful to all the living things, totally blocked by N2 • Far UV (UV-C): l=122-200 nm – very harmful to all the living things, completely absorbed by O2 and O3 • Middle UV (UV-B): l=201-300 nm – harmful to the skin, can damage DNA (causing skin cancer), significantly absorbed by O3 • Near UV (UV-A): l= 301-400 nm – little harmful, transparent
Solar irradiance spectrum above atmosphere and at surface. Extreme UV and X-rays are produced (at left of wavelength range shown) but comprise very small amounts of the Sun's total output power http://en.wikipedia.org/wiki/Sunlight
UV-B energy levels at several altitudes. Blue line shows DNA sensitivity. Red line shows surface energy level with 10% decrease in ozone http://en.wikipedia.org/wiki/Ozone_layer
5-2-3. Air Pollution and Destruction of Ozone Layer • Typical pollutants: chlorofluorcarbon (Freon, CFC), bromofluorcarbon (BFC) – used as coolant, fire extinguisher, sprays, cleaner of electronics, foamer of disposables • will accelerate O3 destruction by (R4) • Has been regulated (banned) by 1987 Montreal Protocol
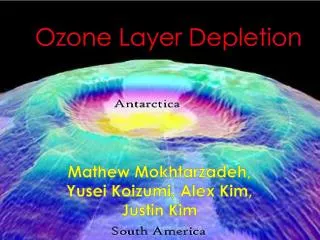
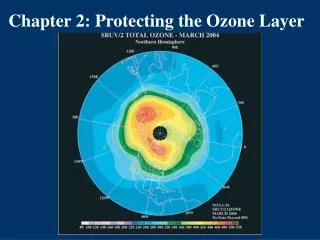
From September 21-30, 2006 the average area of the ozone hole was the largest ever observed, at 10.6 million square miles. This image, from Sept. 24, the Antarctic ozone hole was equal to the record single-day largest area of 11.4 million square miles, reached on Sept. 9, 2000. Satellite instruments monitor the ozone layer, and we use their data to create the images that depict the amount of ozone. The blue and purple colors are where there is the least ozone, and the greens, yellows, and reds are where there is more ozone. Click image to enlarge. Credit: NASA http://www.nasa.gov/vision/earth/lookingatearth/ozone_record.html
The series of images starts with 1974, before CFCs had begun to do significant damage to the ozone layer. Concentrations of ozone in the stratosphere over the United States and Canada are high. By 1994, the model predicts that ozone concentrations over the region have fallen from highs above 500 Dobson Units to about 400. By the simulated year 2009, the ozone layer over much of the United States has thinned to only 300 Dobson Units. By 2020, the model predicts that an ozone “hole”—concentrations below 220 Dobson Units—forms over the Arctic as well as the Antarctic. By 2040, the ozone hole is global. The UV index in mid-latitude cities reaches 15 around noon on a clear summer day (10 is considered extreme today). By the end of the model run, global ozone drops to less than 110 Dobson Units, a 67 percent drop from the 1970s. http://earthobservatory.nasa.gov/IOTD/view.php?id=38685