Download
1 / 56
560 likes | 670 Views
Why the Items versus Parcels Controversy Needn’t Be O ne. Todd D. Little University of Kansas Director, Quantitative Training Program Director, Center for Research Methods and Data Analysis Director, Undergraduate Social and Behavioral Sciences Methodology Minor

E N D
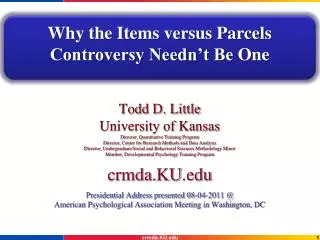
Why the Items versus Parcels Controversy Needn’t Be One Todd D. Little University of Kansas Director, Quantitative Training Program Director, Center for Research Methods and Data Analysis Director, Undergraduate Social and Behavioral Sciences Methodology Minor Member, Developmental Psychology Training Program crmda.KU.edu Presidential Address presented 08-04-2011 @ American Psychological Association Meeting in Washington, DC crmda.KU.edu
Why the Items versus Parcels Controversy Needn’t Be One I Think Todd D. Little University of Kansas Director, Quantitative Training Program Director, Center for Research Methods and Data Analysis Director, Undergraduate Social and Behavioral Sciences Methodology Minor Member, Developmental Psychology Training Program crmda.KU.edu Presidential Address presented 08-04-2011 @ American Psychological Association Meeting in Washington, DC crmda.KU.edu
Overview • Learn what parcels are and how to make them • Learn the reasons for and the conditions under which parcels are beneficial • Learn the conditions under which parcels can be problematic • Disclaimer: This talk reflects my view that parcels per se aren’t controversial if done thoughtfully. crmda.KU.edu 3
Parceling: Averaging (or summing) two or more items to create more reliable indicators of a construct ≈ Packaging items, tying them together Data pre-processing strategy What is Parceling? crmda.KU.edu 4
1* 1* A CFA of Items -.29 Positive 1 Negative 2 .83 .81 .84 .77 .84 .71 .82 .82 .81 .69 .80 .76 Great Cheer ful Happy Good Glad Super Sad Down Un happy Blue Bad Terr ible .43 .31 .34 .30 .41 .30 .50 .32 .34 .35 .52 .35 Model Fit: χ2(53, n=759) = 181.2; RMSEA = .056(.048-.066); NNFI/TLI = .97; CFI = .98 crmda.KU.edu 5
y21 Positive 1 Negative 2 y11 1* 1* y22 11 21 31 42 52 62 Great &Glad Cheerful & Good Happy & Super Terrible &Sad Down & Blue Unhappy & Bad q66 q11 q22 q55 q33 q44 CFA: Using Parcels (6.2.Parcels) Average 2 items to create 3 parcels per construct crmda.KU.edu 6
-.27 Positive 1 Negative 2 1* 1* .89 .89 .91 .87 .87 .91 Great &Glad Cheerful & Good Happy & Super Terrible &Sad Down & Blue Unhappy & Bad .21 .21 .17 .18 .25 .25 CFA: Using Parcels • Similar solution • Similar factor correlation • Higher loadings, • more reliable info • Good model fit, • improved χ2 Model Fit: χ2(8, n=759) = 26.8; RMSEA = .056(.033-.079); NNFI/TLI = .99; CFI = .99 crmda.KU.edu 7
Philosophical Issues To parcel, or not to parcel…? crmda.KU.edu 8
Pragmatic View • “Given that measurement is a strict, rule-bound system that is defined, followed, and reported by the investigator, the level of aggregation used to represent the measurement process is a matter of choice and justification on the part of the investigator” • Preferred terms: remove unwanted, clean, reduce, minimize, strengthen, etc. From Little et al., 2002 crmda.KU.edu 9
Empiricist / Conservative View • “Parceling is akin to cheating because modeled data should be as close to the response of the individual as possible in order to avoid the potential imposition, or arbitrary manufacturing of a false structure” • Preferred terms: mask, conceal, camouflage, hide, disguise, cover-up, etc. From Little et al., 2002 crmda.KU.edu 10
Hobbesian View • Parcels should be avoided because researchers are ignorant (perhaps stupid) and prone to mistakes. And, because the unthoughtful or unaware application of parcels by unwitting researchers can lead to bias, they should be avoided. • Preferred terms: most (all) researchers are un___ as in … unaware, unable, unwitting, uninformed, unscrupulous, etc. crmda.KU.edu 11
Other Issues I Classical school vs. Modeling School Objectivity versus Transparency Items vs. Indicators Factors vs. Constructs Self-correcting nature of science Suboptimal simulations Don’t include population misfit Emphasize the ‘straw conditions’ and proofing the obvious; sometimes over generalize crmda.KU.edu 12
Other Issues II Focus of inquiry Question about the items/scale development? Avoid parcels Question about the constructs? Parcels are warranted but must be done thoughtfully! Question about factorial invariance? Parcels are OK if done thoughtfully. crmda.KU.edu 13
Measurement Measurement starts with Operationalization Defining a concept with specific observable characteristics [Hitting and kicking ~ operational definition of Overt Aggression] Process of linking constructs to their manifest indicants(object/event that can be seen, touched, or otherwise recorded; cf. items vs. indicators) Rule-bound assignment of numbers to the indicants of that which exists [e,g., Never=1, Seldom=2, Often=3, Always=4] … although convention often ‘rules’, the rules should be chosen and defined by the investigator “Whatever exists at all exists in some amount. To know it thoroughly involves knowing its quantity as well as its quality” - E. L. Thorndike (1918) crmda.KU.edu 14
“Indicators are our worldly window into the latent space” - John R. Nesselroade crmda.KU.edu 15
Classical Variants • a) Xi= Ti + Si + ei • b) X = T + S + e • c) X1= T1+ S1+ e1 • Xi : a person’s observed score on an item • Ti: 'true' score (i.e., what we hope to measure) • Si : item-specific, yet reliable, component • ei : random error or noise. • Assume: • Si and eiare normally distributed (with mean of zero) and uncorrelated with each other • Across all items in a domain, the Sis are uncorrelated with each other, as are the eis crmda.KU.edu 16
Latent Variable Variants • a) X1= T+ S1+ e1 • b) X2 = T+ S2 + e2 • c) X3= T+ S3+ e3 • X1-X3: are multiple indicators of the same construct • T : common 'true' score across indicators • S1-S3: item-specific, yet reliable, component • e1-e3 : random error or noise. • Assume: • Ssand esare normally distributed (with mean of zero) and uncorrelated with each other • Across all items in a domain, the Ssare uncorrelated with each other, as are the es crmda.KU.edu 17
Empirical Pros • Psychometric Characteristics of Parcels • (vs. Items) • Higher reliability, communality, & ratio of common-to-unique factor variance • Lower likelihood of distributional violations • More, Smaller, and more-equal intervals Never Seldom Often Always Happy 1 2 3 4 Glad 1 2 3 4 Mean 1 1.5 2 2.5 3 3.5 4 Sum 2 3 4 5 6 7 8 crmda.KU.edu 18
More Empirical Pros • Model Estimation and Fit with Parcels • (vs. Items) • Fewer parameter estimates • Lower indicator-to-subject ratio • Reduces sources of parsimony error (population misfit of a model) • Lower likelihood of correlated residuals & dual factor loading • Reduces sources of sampling error • Makes large models tractable/estimable crmda.KU.edu 19
More Empirical Pros Variance of / 2 = = = ] = T T Construct T + Specific S1 S2 E1 E2 ¼ of their original size! Error 2 crmda.KU.edu 20
Construct = Common Variance of Indicators crmda.KU.edu 21
Construct = Common Variance of Indicators crmda.KU.edu 22
Empirical Cautions T T T Construct + M M S1 S2 Specific E1 E2 ¼ of their original size! Error 2 crmda.KU.edu 23
Construct = Common Variance of Indicators crmda.KU.edu 24
Construct = Common Variance of Indicators crmda.KU.edu 25
y21 Positive 1 Negative 2 y11 1* 1* y22 11 21 31 42 52 62 Great &Glad Cheerful & Good Happy & Super Terrible &Sad Down & Blue Unhappy & Bad q66 q11 q22 q55 q33 q44 Three is Ideal crmda.KU.edu 26
Three is Ideal Matrix Algebra Formula: Σ = Λ Ψ Λ´ + Θ Down & Blue Great & Glad Cheerful & Good Happy & Super Terrible & Sad Unhappy & Bad P1 11y11 11+q11 P2 11y112121y11 21+q22 P3 11y113121y113131y11 31+q33 N1 11y214221y214231y214242y22 42+q44 N211y215221y215231y215242y225252y22 52+q55 N311y216221y216231y216242y2262 52y226262y22 62+q66 • Cross-construct item associations (in box) estimated only via Ψ21– the latent constructs’ correlation. • Degrees of freedom only arise from between construct relations crmda.KU.edu 27
Empirical Cons • Multidimensionality • Constructs and relationships can be hard to interpret if done improperly • Model misspecification • Can get improved model fit, regardless of whether model is correctly specified • Increased Type II error rate if question is about the items • Parcel-allocation variability • Solutions depend on the parcel allocation combination (Sterba & McCallum, 2010; Sterba, in press) crmda.KU.edu 28
Psychometric Issues • Principles of Aggregation (e.g., Rushton et al.) • Any one item is less representative than the average of many items (selection rationale) • Aggregating items yields greater precision • Law of Large Numbers • More is better, yielding more precise estimates of parameters (and a person’s true score) • Normalizing tendency crmda.KU.edu 29
Construct Space with Centroid crmda.KU.edu
Potential Indicators of the Construct crmda.KU.edu
Selecting Six (Three Pairs) crmda.KU.edu
… take the mean crmda.KU.edu
… and find the centroid crmda.KU.edu
Selecting Six (Three Pairs) crmda.KU.edu
… take the mean crmda.KU.edu
… find the centroid crmda.KU.edu
How about 3 sets of 3? crmda.KU.edu
… taking the means crmda.KU.edu
… yields more reliable & accurate indicators crmda.KU.edu
Building Parcels • Theory – Know thy S and the nature of your items. • Random assignment of items to parcels (e.g., fMRI) • Use Sterba’s calculator to find an allocation method that is in the middle of the distribution. • Balancing technique • Combine items with higher loadings with items having smaller loadings [Reverse serpentine pattern] • Using a priori designs (e.g., CAMI) • Develop new tests or measures with parcels as the goal for use in research crmda.KU.edu 41
Techniques: Multidimensional Case • Example: ‘Intelligence’ ~ Spatial, Verbal, Numerical • Domain Representative Parcels • Has mixed item content from various dimensions • Parcel consists of: 1 Spatial item, 1 Verbal item, • and 1 Numerical item • Facet Representative Parcels • Internally consistent, each parcel is a ‘facet’ or • singular dimension of the construct • Parcel consists of: 3 Spatial items • Recommended method crmda.KU.edu 42
Domain Representative Parcels + + = S V N Parcel #1 + + = S V N Parcel #2 + + = S V N Parcel #3 SpatialVerbalNumerical crmda.KU.edu 43
Domain Representative crmda.KU.edu 44
Domain Representative Intellective Ability, Spatial Ability, Verbal Ability, Numerical Ability But which facet is driving the correlation among constructs? crmda.KU.edu 45
Facet Representative Parcels + + = S S S Parcel: Spatial + + = V V V Parcel: Verbal + + = N N N Parcel: Numerical crmda.KU.edu 46
Facet Representative crmda.KU.edu 47
Facet Representative Intellective Ability Diagram depicts smaller communalities (amount of shared variance) crmda.KU.edu 48
Facet Representative Parcels + + = + + = + + = A more realistic case with higher communalities crmda.KU.edu 49
Facet Representative crmda.KU.edu 50