Download
1 / 25
250 likes | 361 Views
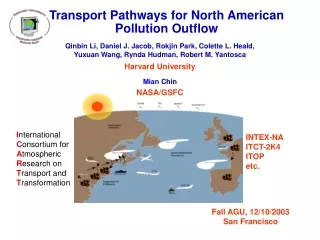
Pathways for North American Outflow - Hindcast for ICART 2. Qinbin Li, Daniel J. Jacob, Rokjin Park, Colette L. Heald, Yuxuan Wang, Rynda Hudman, Robert M. Yantosca Harvard University Mian Chin NASA/GSFC with support from NOAA Atmospheric Chemistry Program.

E N D
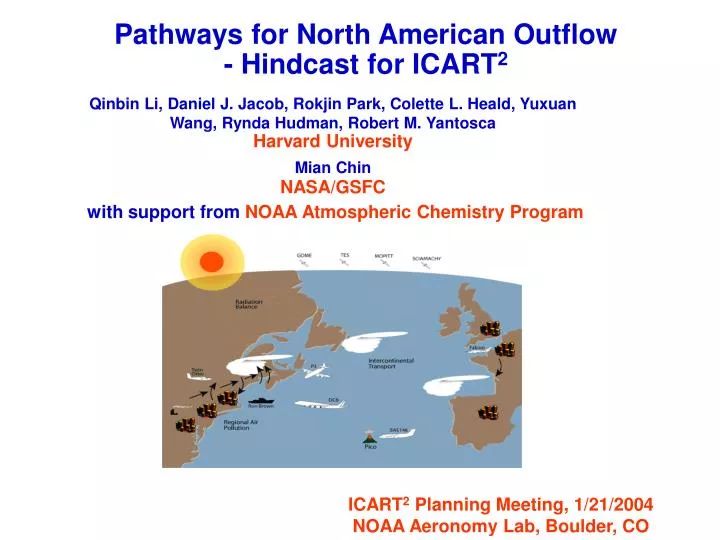
Pathways for North American Outflow - Hindcast for ICART2 Qinbin Li, Daniel J. Jacob, Rokjin Park, Colette L. Heald, Yuxuan Wang, Rynda Hudman, Robert M. Yantosca Harvard University Mian Chin NASA/GSFC with support from NOAA Atmospheric Chemistry Program ICART2 Planning Meeting, 1/21/2004 NOAA Aeronomy Lab, Boulder, CO
Model Simulations GEOS-CHEM • Global 3-D model of tropospheric chemistry-aerosols. • Driven by GMAO GEOS-3 assimilated meteorology. • Used in TRACE-P and ITCT-2K2 chemical hindcasts / forecasts and post-mission analyses. Model Simulations • Time period: June-August of 1998, 2000, 2001, 2002 • Tagged CO (all four years): 2°x2.5° (use 1998 FF and climatological BB emissions for all four years) • Full-chemistry (2000 only): 1°x1° ‘nested’ over North America (use 2000 BB emissions) Observations • MOPITT CO column • MODIS aerosol optical depth • AERONET aerosol optical depth
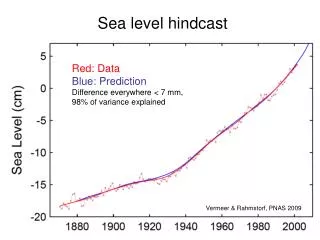
Summer 2004: El Niño, La Niña, or Neutral? The most recent Niño 3.4 SST anomalies fall in the range of near-neutral conditions. Most of the statistical and dynamical model forecasts are indicating slightly above-average conditions over the coming several months.
GEOS-3 750 hPa Winds, 2000 H H Zonally-uniform flow pattern in June, while curve-like flow patterns in July and August. H H
GEOS-3 750 hPa Winds, 1998 H H El Nino influence lasted into June; outflow in June at lower latitudes than other years. H H
H H 500 hPa 300 hPa Recirculation in the middle to upper troposphere. Recirculation in the middle and upper troposphere. H H GEOS-3 500 & 300 hPa Winds
Climatology 2000 BB, July BB, July BB, August BB, August 2000: huge forest fires in NW (Montana, Idaho, Wyoming, etc.) North American Emissions Duncan et al. [2003] unit: 10-12 molec/cm2/s FF BB, June Climatology: extensive boreal forest fires.
Horizontal N. American CO Flux, June 2000 1998 FF outflow at 35ºN-50ºN, BB outflow 45ºN-55ºN. Outflow at much lower latitudes in June 1998.
Horizontal N. American CO Flux, 2000 July August Outflow in July is at lower latitudes than in June. Outflow in August shows features in between June and July.
2000 1998 Vertical and Zonal N. American CO Flux, June 70ºW 300 hPa 70ºW 70ºW Lines – fluxes (vertical: 10-12 moles cm-2 s zonal: 10-9 moles cm-2 s) Color contours –concentrations (ppb) (1) BL and lower FT outflow. (2) Convective outflow in MT/UT.
Vertical and Zonal N. American CO Flux, July 70ºW 300 hPa 70ºW 70ºW Lines – fluxes (vertical: 10-12 moles cm-2 s zonal: 10-9 moles cm-2 s) Color contours –concentrations (ppb) Stronger convective transport than June and August.
Vertical and Zonal N. American CO Flux, August 70ºW 300 hPa 70ºW 70ºW Lines – fluxes (vertical: 10-12 moles cm-2 s zonal: 10-9 moles cm-2 s) Color contours –concentrations (ppb)
AERONET GOES IR Event June 9-13: BL, WCB and Convective Outflow
Event June 9-13: WCB, Convection from Midwest from southeast
AERONET GOES IR Event July 2-7: Outflow at Low Latitude
Enhanced CO. Enhanced ozone and aerosols. Event July 2-7: Outflow at Low Latitude
Recirculationin the Upper Troposphere North American Fossil Fuel CO 270 hPa, July 6-23, 2000 Deep convection in the south-central U.S. followed by recirculation in the MT and UT; fairly aged air masses with high ozone but depleted NOy and aerosols upon leaving the continental U.S. (animation)
AERONET GOES IR Event July 9-14: Recirculation
Enhanced CO in the upper troposphere. Enhanced ozone in the upper troposphere. Event July 9-14: Recirculation
Asian and European Influences Detectable? • Asian and European influences dispersed into the background. • Asian plumes could be seen in strong transpacific transport. > 40 ppbv
N. American Biomass Burning CO, 500 hPa August 2000 Plumes from the huge fires in the northwest US are lifted to 5-8 km by convection and then exported (1) northeastward north of 50ºN (2) eastward by the westerly at 40-50ºN (3) southeastward at 30-45ºN and impacts much of the middle and east U.S. (animation)
N. American Fossil Fuel CO, 850 hPa July, 2000
N. American Fossil Fuel CO, 500 hPa July, 2000
N. American Fossil Fuel CO, 300 hPa July, 2000
Summary and Conclusions • Main pathways: BL and lower FT outflow; Convective outflow in the MT and UT. • Outflows occur at a rather large latitude range (30ºN-55ºN) along the east coast. • Deep convections in the south-central U.S. are often followed by recirculation in the MT and UT over much of the U.S. • Biomass burning outflows generally occur at higher latitudes (45ºN-55ºN) than anthropogenic outflows. • Outflows occur at lower latitudes in July and August than in June due to more curve-like flow patterns in July and August. • MOPITT CO columns and MODIS and AERONET aerosol optical depths provide useful insights in understanding N. American pollution outflow.