Download
1 / 3
30 likes | 138 Views
This document provides an overview of the Cost Per Mille (CPM) indices for various demographics in the TV market, focusing on the P18+ and P16-39 age groups. The national average CPM is standardized to 100 for comparative purposes. Data sources include the 2008 Regional TV Agency Survey, which highlights differences across markets, helping advertisers and agencies identify trends in viewer engagement and ad spending efficiency across demographic segments.

E N D
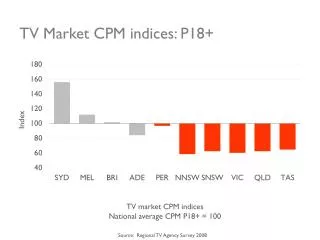
TV Market CPM indices: P18+ Index TV market CPM indices National average CPM P18+ = 100 Source: Regional TV Agency Survey 2008
TV Market CPM indices: GB’s Index TV market CPM indices National average CPM GB’s = 100 Source: Regional TV Agency Survey 2008
TV Market CPM indices: P16-39 Index TV market CPM indices National average CPM P16-39 = 100 Source: Regional TV Agency Survey 2008