Download
1 / 32
320 likes | 466 Views
Earth’s Changing Environment Lecture 7. Global and US Fossil Fuel Resources: Oil and Natural Gas. Fossil Fuels. Formed 50 million to 350 million years ago from plants and animals. Fuels Petroleum Natural Gas Coal Shale Oil Tar Sands. US Energy Consumption (QBtu).

E N D
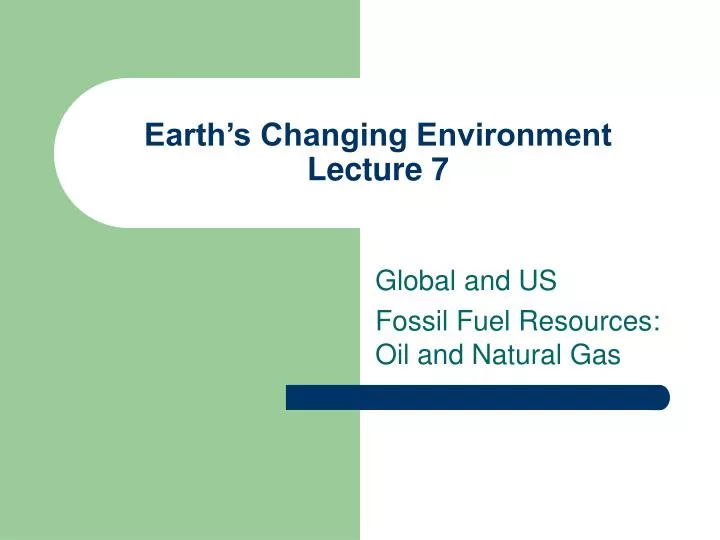
Earth’s Changing EnvironmentLecture 7 Global and US Fossil Fuel Resources: Oil and Natural Gas
Fossil Fuels • Formed 50 million to 350 million years ago from plants and animals. • Fuels • Petroleum • Natural Gas • Coal • Shale Oil • Tar Sands
US Energy Consumption (QBtu) • Petroleum 38 (39%) • Natural Gas 23 (24%)
Oil • Hydrocarbon chains CH2-CH2- CH2----- 2CH2 + 3O2 2CO2 + 2H2O
Natural Gas Primarily Methane CH4 CH4 + 2O2 2H2O + CO2
Oil • Crude oil is measured in barrels. A 42-U.S. gallon barrel of crude oil provides slightly more than 44 gallons of petroleum products.
Oil Refinery After crude oil is removed from the ground, it is sent to a refinery The crude oil is separated into useable petroleumproducts.
Oil Refinery A 42-U.S. gallon barrel of crude oil provides slightly more than 44 gallons of petroleum products. One barrel of crude oil, when refined, produces 20 gallons of finished motor gasoline.
Natural Gas Natural gas prices have fluctuated because of variable supply. New pipelines from Alaska may solve some of this problem.
Reserves and Resources • Reserves are known sources that are extractable with current technologies at current prices. • Resources include sources not currently being exploited because of cost and sources not yet discovered.
Oil and Gas Units • Gbo billion barrels of oil. G stands for Giga. Used for global and US oil resources • TCF trillion cubic feet. Used for global and US natural gas resources.
Example Problem 1 US annual oil consumption equals 7.2 Gbo. Express this value in millions of barrels per day. US Oil consumption = 7.2x10⁹ bbl/ 365 days = 20 million bbl/day (11 million bbl day imported)
Global Oil and Gas Reserves, Resources, Consumption • Oil • Reserves 1,000 Gbo • Resources 1,700 Gbo • Consumption 28 Gbo • Natural Gas • Reserves 5,500 TCF • Resources 10,000 TCF • Consumption 90 TCF
US Oil and Gas Reserves, Resources, Consumption • Oil • Reserves 22 Gbo • Resources 98 Gbo • Consumption 7.2 Gbo • Natural Gas • Reserves 180 TCF • Resources 710 TCF • Consumption 23 TCF
Global Oil Resources • Saudi Arabia 26% • Iraq 11% • Iran 10% • Kuwait 10% • UAE 6% • Russia 5% • Venezuela 5% • Nigeria 3% • Libya 3% • China 3% • Mexico 2% • United States 2%
Global Oil Production • Saudi Arabia 12% • United States 11% • Russia 10% • Iran 5% • Mexico 5% • Norway 5% • China 4% • Venezuela 4% • Canada 4%
Global Natural Gas Resources • Russia 29% • Iran 16% • Qatar 13% • Saudi Arabia 4% • UAE 3% • United States 3% • Algeria 3% • Nigeria 3% • Venezuela 3% • Iraq 2%
Global Natural Gas Production • Russia 23% • United States 22% • Canada 7% • United Kingdom 4% • Algeria 3% • Netherlands 3% • Indonesia 3%
Example Problem 2 • Assuming constant level of consumption, estimate the lifetime of US oil resources Lifetime = 98 Gbo / 7.2 Gbo/year = 14 years • Assuming constant level of consumption, estimate the lifetime of global oil resources Lifetime = 1700 Gbo / 28 Gbo/year = 60 years • What is wrong with these assumptions?
Published Estimates of World Oil Ultimate Recovery USGS 5% 2000 USGS Mean 2000 USGS 95% 2000 Campbell 1995 Masters 1994 Campbell 1992 Bookout 1989 Masters 1987 Martin 1984 Nehring 1982 Halbouty 1981 Meyerhoff 1979 Nehring 1978 Nelson 1977 Folinsbee 1976 Adams & Kirby 1975 Linden 1973 Moody 1972 Moody 1970 Shell 1968 Weeks 1959 MacNaughton 1953 Weeks 1948 Pratt 1942 0 0.5 1 1.5 2 2.5 3 3.5 4 Trillions of Barrels Source: USGS and Colin Campbell
Different Interpretations of a Hypothetical 6,000 Billion Barrel World Original Oil-in-Place Resource Base 6,000 4,200 3,000 Unrecoverable Billion Billion 5,000 Unrecovered Reserves Unrecovered Billion Barrels Growth Undiscovered 4,000 Proved Reserves 50% 3,000 Recovery Reserves Growth Cumulative Factor with Adds 10% Production Reserves Growth 2,000 40% Recovery Factor 30% 1,000 Without Recovery Reserves Factor Growth 0 USGS Approach 1995 Campbell/Laherrere Approach
Campbell-Laherrère World Oil Production Estimates, 1930-2050 Production Peak 2004 Campbell
When will Global Oil Production Peak? • Difficult to predict. • Depends on geology and economics. • Best estimates are sometime between 2004 and 2050.