Download
1 / 34
380 likes | 828 Views
Parametric Tolerance Interval (PTI) Test for Improved Control of Delivered Dose Uniformity (DDU) in Orally Inhaled and Nasal Drug Products (OINDP). Presented by Bo Olsson (AstraZeneca) on behalf of International Pharmaceutical Aerosol Consortium on Regulation and Science (IPAC-RS)

E N D
Parametric Tolerance Interval (PTI) Test for Improved Control of Delivered Dose Uniformity (DDU) in Orally Inhaled and Nasal Drug Products (OINDP) Presented by Bo Olsson (AstraZeneca) on behalf of International Pharmaceutical Aerosol Consortium on Regulation and Science (IPAC-RS) 13 March 2003Rockville, MD
Purpose of Delivered Dose Uniformity Test DDU, which is one of several quality attributes for OINDP, combines performance of delivery device and formulation DDU verifies delivered (emitted) dose in the batch • dose uniformity between containers • dose uniformity within multi-dose containers • closeness of mean dose to target - label claim IPAC-RS
Scope of Products Oral inhalation and nasal drug products (OINDP) are either single-dose or multi-dose • pressurized metered dose inhalers (pMDIs) • dry powder inhalers (DPIs) • nasal sprays • inhalation solutions • deliver medication to the respiratory tract • lung • nasal passages in the form of aerosol to treat diseases and conditions • respiratory (e.g., asthma, COPD, rhinitis) • systemic (e.g., diabetes, migraine) IPAC-RS
Inhalation Product History • First pressurized Metered Dose Inhaler (pMDI) introduced in 1955 • Until early 1990 pMDI technology based on chlorofluorocarbons (CFC) • CFCs linked to ozone depletion and banned by international environmental treaty (Montreal Protocol), phased out in medical use applications • With phase-out of CFC for medical use, reformulation of pMDIs with hydrofluorocarbons (HFCs) and other new types of OINDP became necessary IPAC-RS
OINDP DDU Test History • Regulatory requirements for DDU evolved based on FDA experience with CFC products • DDU testing requirements became more stringent over time • from multiple actuations per test to minimal clinical dose per test • from testing beginning of container only to testing beginning, middle, end • from USP limits to tighter limits • DDU requirements are more challenging for new technology from CMC perspective • Formulation flexibility significantly reduced with HFC’s due to their physico-chemical characteristics and compatibility with excipients • Challenging flow characteristics of powders IPAC-RS
Traditional DDU Tests • USP: counting test, e.g. • 10 doses from one inhaler (3 beginning + 4 middle + 3 end) • no more than 1 of 10 doses outside 75-125% of label claim (LC) • none of 10 doses outside 65-135% LC (zero tolerance) • under certain conditions 2nd tier allowed with larger sample • FDA: counting test with tighter limits, e.g.(through-container-life DDU test for multi-dose pMDIs/DPIs): • 3 doses from each of 3 inhalers (3 beginning + 3 middle + 3 end) • no more than 1 of 9 doses outside 80-120% LC • none of 9 doses outside 75-125% LC (zero tolerance) • each of 3 means (B, M, E) within 85-115% LC • under certain conditions 2nd tier allowed with larger sample IPAC-RS
Reason for DDU Replacement • Parametric Tolerance Interval (PTI) test is proposed as replacement of current FDA DDU tests BECAUSE • PTI test is more powerful and discriminating than current tests • simultaneously uses mean and standard deviation to make quality assessment • The FDA counting test is less efficient in use of data • unnecessarily rejects good batches • The FDA counting test penalizes increased testing • e.g., stability testing increases chances to fail not due to product quality change • OINDP cannot routinely meet expectations in draft Guidances • e.g., many products have been approved with exceptions to DDU test and acceptance criteria in published Guidances IPAC-RS
Origins of PTI Test • Statistical design built on previous work • 1999 AAPS/FDA/USP Workshop presentation by Dr. Walter Hauck • Williams, Adams, Poochikian and Hauck, Pharm. Res. (2002) • JP/EP/USP parametric test for dose uniformity in tablets • Features of FDA Draft Guidance test (e.g., target interval and mean criteria) • Acceptance criteria designed to match or exceed statistical consumer protection implied by published Draft Guidances • Metered Dose Inhaler (MDI) and Dry Powder Inhaler (DPI) Drug Products 1998 • Nasal Spray and Inhalation Solution, Suspension, and Spray Drug Products Draft: 1999, Final: 2002 IPAC-RS
Define Batch Quality With Coverage Target Interval Target Interval Emitted Dose Emitted Dose Coverage = Proportion of doses in the batch that are within target interval Batches having same coverage of given target interval are considered to be of equal quality IPAC-RS
Hypothesis Testing Framework • To assure with high confidence that sub-standard batches are rejected, set statistical hypothesis as: • H0: batch quality is out of specification • Ha: batch quality is in specification • Type I error: batch released but is outside specification • Type II error: batch rejected but is within specification IPAC-RS
Hypothesis Testing Usefulness • Quality of batches released to consumer is of greatest importance • Need to control risk of releasing substandard batches to consumer (i.e., Type I error) • Type I error is controlled independently of sample size • Therefore UNACCEPTABLE (limiting) quality is defined as baseline standard IPAC-RS
Proposed Standard of Batch Quality The proposed limiting quality is set at 85% batch coverage of the 75-125% LC target interval • corresponds to 5% acceptance for FDA multi-dose test This means that commercial batches must far exceed 85% coverage with high confidence IPAC-RS
Comparison of Coverage at Limiting Quality between FDA and PTI tests DDU Test Approach Minimum BATCH Coverage (95% confidence) FDA for single-dose products (Counting Test) 78% coverage of 75-125%LC FDA for multi-dose products (Counting Test) 85% coverage of 75-125%LC IPAC-RS for all OINDP(Parametric Tolerance Interval Test) 85% coverage of 75-125%LC IPAC-RS
PTI Test Mechanics SAMPLE: pre-defined number of units (n), from different portions in container (Life Stages - LS), one dose from each unit CALCULATE: mean (m), standard deviation (s), Acceptance Value (AV) =100-mLS + ks COMPARE: AV 25, 100-mLS 15, and s 25f/k (Maximum Sample Standard Deviation) IF NOT ACCEPTED, GO TO SECOND TIER Target (100%LC) Mean (m) Standard Deviation (s) Emitted Dose • k and f pre-defined based on n • n determined as appropriate for each product IPAC-RS
Revised PTI Test Coefficients Ensure less than 5.1% Type I error for all batch means n - sample size in tier 1/ total sample size for tiers 1+ 2 k1 and k2 - acceptability coefficients in 1st and 2nd tier f - factor for maximum sample standard deviation • Test plan (sample size) selected as appropriate for each product • Consumer protection the same for all sample sizes by design • Producer risk decreases with increasing sample size IPAC-RS
Maximum Type I Error is 5.1% (occurs for smallest sample size at mean deviation of ±9 %LC) Sample size Normal distribution at limiting quality (85% coverage of 100±25% LC) IPAC-RS
Issues Discussed in Previous Meetings with FDA • “Gap” in OC curves • Quality Standard • “Zero tolerance” • Performance for normal and non-normal distributions • Representative sampling from batch • Differences between product types IPAC-RS
Progress to Date for DDU Replacement • FDA has stated that conceptually, PTI approach is acceptable • Need to resolve: acceptance criteria to be used by PTI test IPAC-RS
Operating Characteristic Curve Producer protection region 100 90 80 70 Area of uncertainty 60 Probability to Accept (%) 50 40 30 20 10 5% 0 Consumer protection region Variability (either standard deviation at a given batch mean or coverage) IPAC-RS
Comparison of Operating Characteristic Curves 21 “Gap” LQ FDA test: as in Draft MDI/DPI Guidance • Consumer protection (Limiting Quality, LQ) same • PTI test’s curve is sharper (narrowed area of uncertainty) • Fewer acceptable batches rejected (lower producer risk) • “Gap”: Fewer rejections does not mean lower quality of accepted batches (see simulated production illustration below)
22 Examples of Effect of Deviations on current FDA OC Curve FDA DCU & TCL test as in Draft MDI/DPI Guidance • Majority of OINDP products approved by FDA in 1990-2001 have DDU test or acceptance criteria or both that deviate from draft Guidances (IPAC-RS 2001 survey) • The ”gap” between FDA and PTI OC curves decreases with such deviations, and consumer protection is eroded • PTIT provides reduction of producer risk without compromising consumer protection
Simulated Illustration* (see figures in next two slides) • Unacceptable quality: FDA and PTI tests have comparable performance • Acceptable quality: PTI test rejects fewer acceptable batches than FDA test * Used 5000 simulations, normal distributions IPAC-RS
Unacceptable Quality Batch Mean ~10014, Batch SD ~ 203 Batch SD, s (%LC) Batch SD, s (%LC) Batch SD, s (%LC) Batch SD, s (%LC) 1.2% Accepted by FDA test (median cov= 80.3%) 98.8% Rejected by FDA test (median cov= 76.5%) 0.3% Accepted by PTI test (median cov= 81.2%) 99.7% Rejected by PTI test (median cov= 76.6%) IPAC-RS
Acceptable Quality Batch Mean ~1009, Batch SD ~103 Batch SD, s (%LC) Batch SD, s (%LC) Batch SD, s (%LC) Batch SD, s (%LC) 65% Accepted by FDA test (median cov= 98.6%) 35% Rejected by FDA test (median cov= 96.5%) 95% Accepted by PTI test (median cov= 98.1%) 5% Rejected by PTI test (median cov= 91.5%) IPAC-RS
Quality Standard Quality of a batch should be judged against a specific standard. Within presented hypothesis framework that standard is • Limiting (Unacceptable) Quality • coverage corresponding to 5% acceptance probability • consumer protection • typical batch quality has to be far above the limiting quality to achieve reasonable batch acceptance probability not • Typical Batch Quality • coverage corresponding to e.g., greater than 95% acceptance • producer risk • is different for different products IPAC-RS
Proposed Quality Standard • IPAC-RS 2001 Proposal: Limiting quality set to 85% coverage of 75 -125% LC interval • same limiting quality as implied by Draft Guidances • demonstrated for each batch with high confidence • FDA comment: tighter standard may be needed • Significantly tighter standard will be problematic • in setting the standard, both producer risk and consumer protection should be considered • standard must be compatible with capability of current and pipeline products and analytical methodology • if standard exceeds capability, it will create difficulties for manufacturing of current products, and development and approval of new products and generic versions IPAC-RS
Non-Normal Distributions • IPAC-RS database demonstrates that assumption of normality is appropriate • Studied non-normal distributions: symmetric short-tailed (beta) or bimodal, asymmetric short-tailed (beta and gamma) or long-tailed (outliers) • Revised PTI test assures < 5.1 % Type I error for all normal and most non-normal distributions • For a few extreme distributions, 5% is exceeded at the limiting quality: • Notably off-target, relatively symmetric distributions with extremely short tails • Notably off-target, notably asymmetric distributions with longer tail in the off-target direction • PTI test is appropriate for real products IPAC-RS
Effect of Zero Tolerance (ZT) Criteria • A ZT criterion does not protect from having values outside ZT limits in the batch • A fixed ZT criterion degrades parametric tests;this effect escalates with sample size • A ZT must scale with sample size in order to avoid degrading parametric test and to have no effect on producer risk • A scaled ZT has little or no effect on consumer protection even for extreme non-normal distributions • Any ZT penalizes thorough testing (stability, validations) • Conclusion: ZT does not help control product quality IPAC-RS
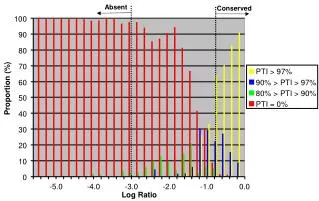
ZT Criterion Has No or Little Effect on Acceptance rate at 85% coverage The addition of ZT criterion does not materially improve consumer protection IPAC-RS
Desired Outcome of DDU Effort for IPAC-RS • Agree that PTI test is conceptually acceptable as a replacement • Parametric (no Zero Tolerance) • Coverage as quality definition • Allow product-by-product justification of sample size n • multiple sampling plans, e.g., 12/36 to 30/90 • Maintain limiting quality standard implied by FDA Guidances • 85% coverage of 75-125% LC target interval • 5% acceptance (95% rejection) at limiting quality IPAC-RS
Acknowledgements • FDA / CDER / OPS • IPAC-RS Members • Aradigm • AstraZeneca • Aventis • Boehringer Ingelheim • Eli Lilly • GlaxoSmithKline • Members of IPAC-RS DDU Working Group • IPAC-RS Secretariat • IVAX • Kos Pharmaceuticals • Nektar Therapeutics • Novartis • Pfizer • Schering-Plough IPAC-RS