Download
1 / 111
1.11k likes | 1.14k Views
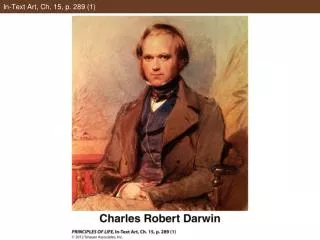
In-Text Art, Ch. 15, p. 289 (1). In-Text Art, Ch. 15, p. 289 (2). Figure 15.1 The Voyage of the Beagle. Figure 15.2 Milestones in the Development of Evolutionary Theory. Concept 15.1 Evolution Is Both Factual and the Basis of Broader Theory.

E N D
Figure 15.2 Milestones in the Development of Evolutionary Theory
Concept 15.1 Evolution Is Both Factual and the Basis of Broader Theory Discuss the validity of the following statement: When scientists speak of evolutionary theory, the word “theory” has the same meaning as it does in everyday language, referring to the fact that evolutionary theory is just an idea that is not proven and backed by scientific evidence.
Concept 15.1 Evolution Is Both Factual and the Basis of Broader Theory Consider the validity of the following statement and then select a correct answer from the options given: When scientists speak of evolutionary theory, the word “theory” has the same meaning as it does in everyday language, referring to the fact that evolutionary theory is just an idea that is not proven and backed by scientific evidence. a. True b. False c. I don’t understand the question.
Concept 15.2 Mutation, Selection, Gene Flow,Genetic Drift, and Nonrandom Mating Result in Evolution Biological evolution refers to changes in the genetic makeup of populations over time. Population—a group of individuals of a single species that live and interbreed in a particular geographic area at the same time. Individuals do not evolve; populations do.
Concept 15.2 Mutation, Selection, Gene Flow,Genetic Drift, and Nonrandom Mating Result in Evolution Because of mutation, different forms of a gene, or alleles, may exist at a locus. Gene pool—sum of all copies of all alleles at all loci in a population. Allele frequency—proportion of each allele in the gene pool. Genotype frequency—proportion of each genotype among individuals in the population.
Concept 15.2 Mutation, Selection, Gene Flow,Genetic Drift, and Nonrandom Mating Result in Evolution Genetic drift—random changes in allele frequencies from one generation to the next. In small populations, it can change allele frequencies. Harmful alleles may increase in frequency, or rare advantageous alleles may be lost.
Concept 15.2 Mutation, Selection, Gene Flow,Genetic Drift, and Nonrandom Mating Result in Evolution A population bottleneck—an environmental event results in survival of only a few individuals. Genetic drift can change allele frequencies. Populations that go through bottlenecks loose much of their genetic variation.
Concept 15.2 Mutation, Selection, Gene Flow,Genetic Drift, and Nonrandom Mating Result in Evolution Founder effect—genetic drift changes allele frequencies when a few individuals colonize a new area.
Concept 15.2 Mutation, Selection, Gene Flow,Genetic Drift, and Nonrandom Mating Result in Evolution Sexual selection—mates are chosen based on phenotype, e.g., bright-colored feathers of male birds. There may be a trade-off between attracting mates (more likely to reproduce) and attracting predators (less likely to survive).
Concept 15.2 Mutation, Selection, Gene Flow,Genetic Drift, and Nonrandom Mating Result in Evolution Or, phenotype may indicate a successful genotype, e.g., female frogs are attracted to males with low-frequency calls, which are larger and older (hence successful). Studies of African long-tailed widowbirds showed that females preferred males with longer tails, which may indicate greater health and vigor.
Concept 15.2 Mutation, Selection, Gene Flow, Genetic Drift, and Random Mating Result in Evolution Discuss the following scenarios with reference to whether or not they correctly describe examples of the process we attribute to having been first described by Charles Darwin - evolution by “natural selection”: The development of a curved back over the period of your lifetime Giraffes’ necks lengthening during their lifetime as they reach up to high branches to eat the leaves of trees A drought affects an island where a population of a particular finch species lives. The species naturally has a small amount of variability in bill (beak) size. The drought results in finches with larger bills surviving at a greater rate than those with smaller bills, since the larger billed birds can crack open and eat very tough seeds that the small billed individuals cannot. A mutation in an insect results in increased digestive efficiency that allows females to obtain more energy from their food, and convert that energy into larger eggs that are more likely to survive, resulting in these females producing more surviving offspring
Concept 15.2 Mutation, Selection, Gene Flow, Genetic Drift, and Random Mating Result in Evolution Which of the following scenarios correctly describe examples of the process we attribute to having been first described by Charles Darwin - evolution by “natural selection”: a. The development of a curved back over the period of your lifetime b. Giraffes’ necks lengthening during their lifetime as they reach up to high branches to eat the leaves of trees c. A drought affects an island where a population of a particular finch species lives. The species naturally has a small amount of variability in bill (beak) size. The drought results in finches with larger bills surviving at a greater rate than those with smaller bills, since the larger billed birds can crack open and eat very tough seeds that the small billed individuals cannot. d. A mutation in an insect results in increased digestive efficiency that allows females to obtain more energy from their food, and convert that energy into larger eggs that are more likely to survive, resulting in these females producing more surviving offspring e. Both c and d
Concept 15.3 Evolution Can Be Measured by Changes in Allele Frequencies Evolution can be measured by change in allele frequencies. Allele frequency =
Concept 15.3 Evolution Can Be Measured by Changes in Allele Frequencies For two alleles at a locus, A and a, three genotypes are possible: AA, Aa, and aa. p = frequency of A;q = frequency of a
Concept 15.3 Evolution Can Be Measured by Changes in Allele Frequencies For each population, p + q = 1, and q = 1 – p. Monomorphic: only one allele at a locus, frequency = 1. The allele is fixed. Polymorphic: more than one allele at a locus. Genetic structure—frequency of alleles and genotypes of a population.
Concept 15.3 Evolution Can Be Measured by Changes in Allele Frequencies Hardy–Weinberg equilibrium—allele frequencies do not change across generations; genotype frequencies can be calculated from allele frequencies. If a population is at Hardy-Weinberg equilibrium, there must be no mutation, no gene flow, no selection of genotypes, infinite population size, and random mating.
Concept 15.3 Evolution Can Be Measured by Changes in Allele Frequencies At Hardy-Weinberg equilibrium, allele frequencies don’t change. Genotypes frequencies: Genotype AA Aa aa Frequency p2 2pq q2
Figure 15.11 One Generation of Random Mating Restores Hardy–Weinberg Equilibrium
Figure 15.11 One Generation of Random Mating Restores Hardy–Weinberg Equilibrium (Part 1)
Figure 15.11 One Generation of Random Mating Restores Hardy–Weinberg Equilibrium (Part 2)
Concept 15.3 Evolution Can Be Measured by Changes in Allele Frequencies Probability of 2 A-gametes coming together: Probability of 2 a-gametes coming together: Overall probability of obtaining a heterozygote:
Apply the Concept page 299 • Evolution can be measured by changes in allele frequencies • Imagine you have discovered a new population of curly-tailed lizards established on an island after immigrants have arrived from several different source populations during a hurricane. You collect and tabulate genotype data for the lactate dehydrogenase gene (ldh) for each of the individual lizards • Use the table to answer the following questions.
Calculate the allele and genotype frequencies of ldh in this newly founded population. • Is the population in Hardy-Weinberg equilibrium? If not, which genotypes are over- or underrepresented? Given the population’s history, what is a likely explanation for your answer? • Under Hardy-Weinberg assumptions, what allele and genotype frequencies do you predict for the next generation? • Imagine that you are able to continue studying this population and determine the next generation’s actual allele and genotype frequencies. What are some of the principal reasons you might expect the observed allele frequency to differ from the Hardy-Weinberg expectations you calculated in question 3?
Concept 15.3 Evolution Can Be Measured by Changes in Allele Frequencies Consider and discuss the following scenarios in relation to Hardy–Weinberg equilibrium, and determine whether or not allele frequencies are likely to change, leading to evolution: An isolated and highly endangered population of 50 woodland caribou A large population of lizards whose males have red, blue, or green tails; females preferentially mate with red-tailed males A large population of fish in an isolated lake; every 5 years a flood results in some fish from a population in an adjacent lake mixing with this population
Concept 15.3 Evolution Can Be Measured by Changes in Allele Frequencies In which of the following scenarios are allele frequencies are likely to change, leading to evolution, according to Hardy–Weinberg assumptions: a. An isolated and highly endangered population of 50 woodland caribou b. A large population of lizards whose males have red, blue, or green tails; females preferentially mate with red-tailed males c. A large population of fish in an isolated lake; every 5 years a flood results in some fish from a population in an adjacent lake mixing with this population d. All of the above e. None of the above
Concept 15.4 Selection Can Be Stabilizing, Directional, or Disruptive Natural selection can act on quantitative traits in three ways: • Stabilizing selection favors average individuals. • Directional selection favors individuals that vary in one direction from the mean. • Disruptive selection favors individuals that vary in both directions from the mean.
Concept 15.4 Selection Can Be Stabilizing, Directional, or Disruptive Stabilizing selection reduces variation in populations, but does not change the mean. It is often called purifying selection—selection against any deleterious mutations to the usual gene sequence.
Figure 15.12 Natural Selection Can Operate in Several Ways (Part 1)
Figure 15.12 Natural Selection Can Operate in Several Ways (Part 2)
Figure 15.12 Natural Selection Can Operate in Several Ways (Part 3)