Download
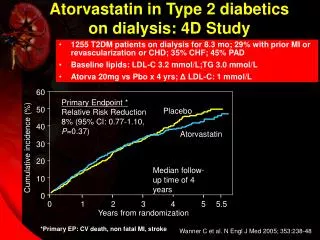
1 / 46
480 likes | 705 Views
CHAPTER 2 DIALYSIS IN MALAYSIA. Goh Bak Leong Lim Yam Ngo Ong Loke Meng Ghazali Ahmad Lee Day Guat. Source: 21 st MDTR Report 2013, NRR. Table 2.1.1(a): Stock and flow-Haemodialysis Patients 2004-2013. Source: 21 st MDTR Report 2013, NRR.

E N D
CHAPTER 2DIALYSIS IN MALAYSIA Goh Bak Leong Lim Yam Ngo Ong Loke Meng Ghazali Ahmad Lee Day Guat Source: 21st MDTR Report 2013, NRR
Table 2.1.1(a): Stock and flow-Haemodialysis Patients 2004-2013 Source: 21st MDTR Report 2013, NRR
Table 2.1.1(b): Stock and flow- Chronic PD Patients 2004-2013 Source: 21st MDTR Report 2013, NRR
Table 2.1.1 (c): Haemodialysis Treatment Rate per million population 2004-2013 Source: 21st MDTR Report 2013, NRR
Table 2.1.1 (d): Chronic PD Treatment Rate per million population 2004-2013 Source: 21st MDTR Report 2013, NRR
Table 2.1.2: Dialysis Treatment Rate by state, per million population 2004-2013 Source: 21st MDTR Report 2013, NRR
Table 2.1.3(a) : Dialysis Treatment Rate by Gender, per million male or female population 2004-2013 Source: 21st MDTR Report 2013, NRR
Figure 2.1.3(a): Dialysis Treatment Rate by Gender 2004-2013 Male Female 240 210 180 150 Treatment rate, per million population 120 90 60 30 0 2004 2005 2006 2007 2008 2009 2010 2011 2012 2013 Year Source: 21st MDTR Report 2013, NRR
Table 2.1.3(b): Gender Distribution of Dialysis Patients 2004-2013 Source: 21st MDTR Report 2013, NRR
Figure 2.1.3(b): Gender Distribution of Dialysis Patients 2004-2013 Male Female Male Female 60 60 50 50 40 40 Proportion of patients Proportion of patients 30 30 20 20 10 10 0 0 2004 2005 2006 2007 2008 2009 2010 2011 2012 2013 2004 2005 2006 2007 2008 2009 2010 2011 2012 2013 Year Year (ii) patients at 31st December • New Dialysis patients Source: 21st MDTR Report 2013, NRR
Table 2.1.4 (a): Dialysis Treatment Rate by Age Group, per million age group population 2004-2013 Source: 21st MDTR Report 2013, NRR
Figure 2.1.4 (a): Dialysis Treatment Rate by Age Group 2004-2013 1200 1000 800 600 Treatment rateper million population 400 200 0 2004 2005 2006 2007 2008 2009 2010 2011 2012 year Age group 1-14 years Age group 15-24 years Age group 25-34 years Age group 35-44 years Age group 45-54 years Age group 55-64 years Age group >=65 years Source: 21st MDTR Report 2013, NRR
Table 2.1.4 (b): Percentage Age Distribution of Dialysis Patients 2004-2013 Source: 21st MDTR Report 2013, NRR
Figure 2.1.4 (b): Age Distribution of New Dialysis Patients 2004-2013 Age group 1-24 years Age group 25-34 years Age group 35-44 years Age group 45-54 years Age group 55-64 years Age group >=65 years 100 90 80 70 60 Proportion of patients 50 40 30 20 10 0 '04 '05 '06 '07 '08 '09 '10 '11 '12 '13 Year • New Dialysis Patients Source: 21st MDTR Report 2013, NRR
(ii) Dialysing patients at 31st December Age group 25-34 years Age group 1-24 years Age group 35-44 years Age group 45-54 years Age group 55-64 years Age group >=65 years 100 90 80 70 60 Proportion of patients 50 40 30 20 10 0 '04 '05 '06 '07 '08 '09 '10 '11 '12 '13 Year Source: 21st MDTR Report 2013, NRR
Table 2.1.5: Method and Location of Dialysis Patients 2004-2013 Source: 21st MDTR Report 2013, NRR
Figure 2.1.5: Method and Location of Dialysis Patients 2004-2013 Centre HD Home and office HD CAPD 100 90 80 70 60 Proportion of patients 50 40 30 20 10 0 2004 2005 2006 2007 2008 2009 2010 2011 2012 2013 Year • New Dialysis Patients Source: 21st MDTR Report 2013, NRR
ii) Dialysing patients at 31st December Centre HD Home and office HD CAPD 100 90 80 70 60 Proportion of patients 50 40 30 20 10 0 2004 2005 2006 2007 2008 2009 2010 2011 2012 2013 Year Source: 21st MDTR Report 2013, NRR
Table 2.1.6: Funding for Dialysis Treatment 2004-2013 Source: 21st MDTR Report 2013, NRR
Figure 2.1.6: Funding for Dialysis Treatment 2004-2013 Government funded Charity Self funded Employer subsidy Others 100 90 80 70 60 Proportion of patients 50 40 30 20 10 0 2004 2005 2006 2007 2008 2009 2010 2011 2012 2013 Year (i) New Dialysis Patients Source: 21st MDTR Report 2013, NRR
ii) Dialysing patients at 31st December Government funded Charity Self funded Employer subsidy Others 100 90 80 70 60 Proportion of patients 50 40 30 20 10 0 2004 2005 2006 2007 2008 2009 2010 2011 2012 2013 Year Source: 21st MDTR Report 2013, NRR
Table 2.1.7: Distribution of Dialysis Patients by Sector 2004-2013 Source: 21st MDTR Report 2013, NRR
Figure 2.1.7: Distribution of Dialysis Patients by Sector 2004-2013 Public centre NGO centre Private centre 100 90 80 70 60 Proportion of patients 50 40 30 20 10 0 2004 2005 2006 2007 2008 2009 2010 2011 2012 2013 Year (i) New Dialysis Patients Source: 21st MDTR Report 2013, NRR
(ii) Dialysing patients at 31st December Public centre NGO centre Private centre 100 90 80 70 60 Proportion of patients 50 40 30 20 10 0 '04 '05 '06 '07 '08 '09 '10 '11 '12 '13 Year Source: 21st MDTR Report 2013, NRR
Table 2.1.8: Primary Renal Diseases 2004-2013 Source: 21st MDTR Report 2013, NRR
Figure 2.1.8: Primary Renal Diseases for New Dialysis Patients 2004-2013 Unknown cause Diabetes Mellitus GN and SLE Toxic Nephropathy,Hypertension & Others Obstructive Nephropathy Polycystic kidney 100 90 80 70 60 Proportion of patients 50 40 30 20 10 0 2004 2005 2006 2007 2008 2009 2010 2011 2012 2013 Year Source: 21st MDTR Report 2013, NRR
Table 2.2.1: Number and density of Dialysis Centres in Malaysia by State and Sector, Year 2004 to 2013 Source: 21st MDTR Report 2013, NRR
Figure 2.2.1(a): Number of Dialysis Centre in Malaysia by Sector, 2004 to 2013 Public Private NGO 700 600 500 400 Number of Dialysis Centre 300 200 100 0 2004 2005 2006 2007 2008 2009 2010 2011 2012 2013 Source: 21st MDTR Report 2013, NRR
Figure 2.2.1(b): Number of Dialysis Centre in Malaysia by State and Sector in 2013 Source: 21st MDTR Report 2013, NRR
Table 2.2.2: Number and density of HD centres in Malaysia by State and Sector, 2004-2013 Source: 21st MDTR Report 2013, NRR
Table 2.2.3: Number and density of PD centres in Malaysia by State and Sector, 2004-2013 Source: 21st MDTR Report 2013, NRR
Table 2.2.4: Number and density of HD machines in Malaysia by State and Sector, 2004-2013 Source: 21st MDTR Report 2013, NRR
Figure 2.2.4(a): Number of HD machines in Malaysia by Sector from Year 2004 to 2013 Public Private NGO 4000 3500 3000 2500 2000 Number of HD machine 1500 1000 500 0 2004 2005 2006 2007 2008 2009 2010 2011 2012 2013 year Source: 21st MDTR Report 2013, NRR
Figure 2.2.4(b): Number of HD machines in Malaysia by State and Sector in Year 2013 Source: 21st MDTR Report 2013, NRR
Table 2.2.5: Number and Prevalence Rate of Dialysis Patients (HD & PD) in Malaysia by State and Sector, 2004-2013 Source: 21st MDTR Report 2013, NRR
Figure 2.2.5(a): Number of Dialysis Patient (HD+PD) in Malaysia by Sector from 2004-2013 Public Private NGO 14000 12000 10000 8000 Number of Dialysis Patients 6000 4000 2000 0 2004 2005 2006 2007 2008 2009 2010 2011 2012 2013 year Source: 21st MDTR Report 2013, NRR
Figure 2.2.5(b): Number of Dialysis Patient (HD+PD) in Malaysia by State and Sector in 2013 Source: 21st MDTR Report 2013, NRR
Table 2.2.6: Number and Prevalence Rate of Hemodialysis Patients in Malaysia by State and Sector, 2004-2013 Source: 21st MDTR Report 2013, NRR
Table 2.2.7: Number and Prevalence Rate of PD Patients in Malaysia by State and Sector, 2004-2013 Source: 21st MDTR Report 2013, NRR
Table 2.2.8: HD Capacity to Patient Ratio among HD Centres in Malaysia by State and Sector, 2004-2013 Source: 21st MDTR Report 2013, NRR
Continue; Source: 21st MDTR Report 2013, NRR
Figure 2.2.8(a): HD Capacity to Patient Ratio among HD Centres in Malaysia by State and Sector, 2004-2013 Public Private NGO 2.4 2.3 2.2 2.1 2 1.9 HD Capacity to Patient Ratio 1.8 1.7 1.6 1.5 1.4 1.3 2004 2005 2006 2007 2008 2009 2010 2011 2012 2013 year Source: 21st MDTR Report 2013, NRR
Figure 2.2.8(b): HD Capacity to Patient Ratio among HD Centres in Malaysia by State and sector, 2013 Source: 21st MDTR Report 2013, NRR
Table 2.2.9: Number & density of Certified Dialysis Nurses/ Medical technicians in Malaysia by State and Sector, 2004-2013 Source: 21st MDTR Report 2013, NRR
Figure 2.2.9(a): Number of Certified Dialysis Nurses/ Medical technicians in Malaysia by Sector, 2004-2013 Public Private NGO 1200 1000 800 600 Number of Nurses/Medical Technicians 400 200 0 2004 2005 2006 2007 2008 2009 2010 2011 2012 2013 year Source: 21st MDTR Report 2013, NRR
Figure 2.2.9(b): Number of Certified Dialysis Nurses/ Medical technicians in Malaysia by State and Sector, 2013 Source: 21st MDTR Report 2013, NRR