Lecture 3 Normal distribution, stem-leaf, histogram
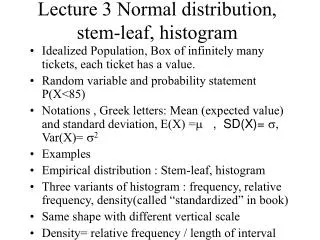
Lecture 3 Normal distribution, stem-leaf, histogram. Idealized Population, Box of infinitely many tickets, each ticket has a value. Random variable and probability statement P(X<85)

Lecture 3 Normal distribution, stem-leaf, histogram
E N D
Presentation Transcript
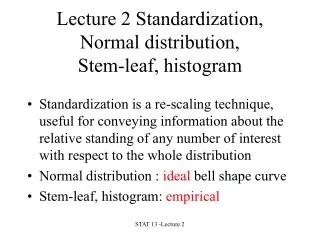
Lecture 3 Normal distribution, stem-leaf, histogram • Idealized Population, Box of infinitely many tickets, each ticket has a value. • Random variable and probability statement P(X<85) • Notations , Greek letters: Mean (expected value) and standard deviation, E(X) =m , SD(X)= s, Var(X)= s2 • Examples • Empirical distribution : Stem-leaf, histogram • Three variants of histogram : frequency, relative frequency, density(called “standardized” in book) • Same shape with different vertical scale • Density= relative frequency / length of interval
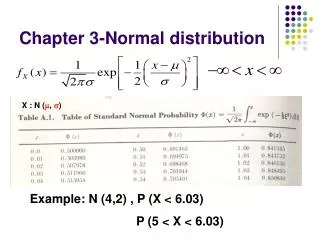
Given a box of tickets with values that come from a normal distribution with mean 75 and standard deviation 15, what is the probability that a randomly selected ticket will have a value less than 85? • Let X be the number elected ( a random variable). • Pr( X<85).
How does the normal table work? • Start from Z=0.0 , then Z=0.1 • Increasing pattern observed • On the negative side of Z • Use symmetry
How to standardize? • Find the mean • Find the standard deviation • Z= (X-mean)/SD • Reverse questions: • How to recover X from Z? • How to recover X from percentile?
Suppose there are 20 percent students failing the exam • What is the passing grade? • Go from percentage to Z, using normal table • Convert Z into X, using X=mean + Z times SD
Probability for an interval • P (60<X<85) • Draw the curve (locate mean, and endpoints of interval) • =P(X<85)-P(X<60) where • P(X<60)= P(Z<(60-75)/15)=P(Z<-1)=1-P(Z<1)=1-.841= about .16