Download
1 / 118
1.19k likes | 1.21k Views
Chapter 19 Climate Control and Ozone Depletion. Science Focus: Melting Ice in Greenland. Largest island: 80% composed of glaciers 10% of the world ’ s fresh water Glacial melting and movement accelerating Effect on sea level if melting continues 1 meter rise by 2100. Solutions?.

E N D
Chapter 19 Climate Control and Ozone Depletion
Science Focus: Melting Ice in Greenland • Largest island: 80% composed of glaciers • 10% of the world’s fresh water • Glacial melting and movement accelerating • Effect on sea level if melting continues • 1 meter rise by 2100
Solutions? • Give four proposed steps for mitigating/eliminating greenhouse gas emissions and climate change. • Carbon capture and storage • Forest restoration • Altering/speeding weathering processes on land/oceans • At source (coal-fired power plant) • Renewable energy • Carbon emissions tax • Energy efficiency
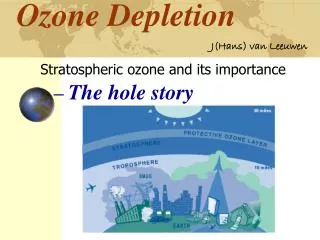
Ozone Depletion • What is it? • Why is it of concern? • i.e., What are the negative consequences? • Causes? • What has/can be done to mitigate/stop? • International agreements in place?
19-1 How Might the Earth’s Temperature and Climate Change in the Future? • Concept 19-1 Considerable scientific evidence indicates that the earth’s atmosphere is warming, because of a combination of natural effects and human activities, and that this warming is likely to lead to significant climate disruption during this century.
Weather and Climate Are Not the Same • Weather is short-term changes • Temperature • Air pressure • Precipitation • Wind • Climate is average conditions in a particular area over a long period of time • Temperature • Precipitation • Fluctuations are normal
Climate Change is Not New (1) • Over the past 4.7 billion years the climate has been altered by • Volcanic emissions • Changes in solar input • Movement of the continents • Impacts by meteors • Changing global air and ocean circulation • Over the past 900,000 years • Glacial and interglacial periods
Climate Change is Not New (2) • Over the past 10,000 years • Interglacial period • Over the past 1,000 years • Temperature stable • Over the past 100 years • Temperature changes; methods of determination
Estimated Changes in the Average Global Temperature of the Atmosphere Fig. 19-2, p. 494
17 16 15 14 Average surface temperature (°C) 13 12 11 10 9 900 800 700 600 500 400 300 200 100 Present Thousands of years ago Fig. 19-2a, p. 494
15.0 14.8 14.6 14.4 Average surface temperature (°C) 14.2 14.0 13.8 13.6 1880 1900 1920 1940 1960 1980 2000 2020 Year Fig. 19-2b, p. 494
TEMPERATURE CHANGE (over past 22,000 years) 2 Agriculture established 1 0 -1 Temperature change (°C) End of last ice age -2 -3 Average temperature over past 10,000 years = 15°C (59°F) -4 -5 20,000 10,000 2,000 1,000 200 100 Now Years ago Fig. 19-2c, p. 494
0.5 0.0 Temperature change (°C) -0.5 -1.0 1000 1100 1200 1300 1400 1500 1600 1700 1800 1900 2000 2100 Year Fig. 19-2d, p. 494
AVERAGE TEMPERATURE (over past 900,000 years AVERAGE TEMPERATURE (over past 130 years TEMPERATURE CHANGE (over past 22,000 years TEMPERATURE CHANGE (over past 1,000 years Stepped Art Fig. 19-2, p. 494
Science: Ice Cores Are Extracted by Drilling Deep Holes in Ancient Glaciers Fig. 19-3, p. 495
Our Climate, Lives, and Economies Depend on the Natural Greenhouse Effect • Greenhouse gases absorb heat radiated by the earth • The gases then emit infrared radiation that warms the atmosphere • Without the natural greenhouse effect • Cold, uninhabitable earth
Human Activities Emit Large Quantities of Greenhouses Gases • Since the Industrial Revolution • CO2, CH4, and N2O emissions higher • Main sources: agriculture, deforestation, and burning of fossil fuels • Correlation of rising CO2 and CH4 with rising global temperatures
Atmospheric Levels of CO2 and CH4, Global Temperatures, and Sea Levels Fig. 19-4, p. 496
400 380 360 340 320 300 280 260 240 220 200 180 160 CO2 concentration (ppm) CO2 400,000 350,000 300,000 250,000 200,000 150,000 100,000 50,000 0 Year before present Fig. 19-4a, p. 496
800 CH4 700 600 CH4 concentration (ppb) 500 400 300 400,000 350,000 300,000 250,000 200,000 150,000 100,000 50,000 0 Year before present Fig. 19-4b, p. 496
4° 2° 0° –2° –4° –6° –8° –10° Temperature Temperature change (°C) 400,000 350,000 300,000 250,000 200,000 150,000 100,000 50,000 0 Year before present Fig. 19-4c, p. 496
20 Sea level 0 –20 –40 –60 –80 –100 –120 Sea level (m) 400,000 350,000 300,000 200,000 250,000 150,000 100,000 50,000 0 Year before present Fig. 19-4d, p. 496
Stepped Art Fig. 19-4, p. 496
Correlation of CO2 and Temperature Fig. 19-5, p. 497
15.0 400 Average annual temperature Running mean CO2 14.8 380 14.6 360 14.4 14.2 340 Average surface temperature (°C) Atmospheric CO2 concentration (ppm) 14.0 320 13.8 300 13.6 280 13.4 1880 1900 1920 1940 1960 1980 2000 2020 Year Fig. 19-5, p. 497
CO2 Concentrations, 1960-2009 Figure 14, Supplement 9
Human Activities Play a Key Role in Recent Atmospheric Warming (1) • Intergovernmental Panel on Climate Change (IPCC), with 2010 updates • 90–99% likely that lower atmosphere is warming • Especially since 1960 • Mostly from human-caused increases in greenhouse gases • Earth’s climate is now changing from increased greenhouse gases • Increased greenhouse gas concentrations will likely trigger significant climate disruption this century • Ecological, economic, and social disruptions
Human Activities Play a Key Role in Recent Atmospheric Warming (2) • Intergovernmental Panel on Climate Change (IPCC), with 2010 updates, cont. • 1906–2005: Ave. temp increased about 0.74˚C • 1970–2009: Annual greenhouse emissions from human activities up 70% • 2000-2009 warmest decade since 1881 • Past 50 years: Arctic temp rising almost twice as fast as the rest of the earth • Melting of glaciers and increased floating sea ice • Last 100 years: sea levels rose 19 cm
Human Activities Play a Key Role in Recent Atmospheric Warming (3) • What natural and human-influenced factors could have an effect on temperature changes? • Amplify • Dampen
Melting of Alaska’s Muir Glacier between 1948 and 2004 Fig. 19-6, p. 499
The Big Melt: Some of the Floating Sea Ice in the Arctic Sea Fig. 19-7, p. 499
Sept. 1979 Sept. 2007 Russia Russia Greenland North pole North pole Greenland Alaska (U.S.) Alaska (U.S.) Canada Canada Stepped Art Fig. 19-7, p. 499
Stepped Art Fig. 19-7, p. 507
Science Focus: How Valid Are IPCC Conclusions? • 2500 scientists working for over two decades to reach consensus on climate change data and likely impact • Unanimity impossible to achieve • Gaps in data • Debate about interpreting data • Need for better models • 2007 IPCC report and Nobel Prize
Science Focus: Using Models to Project Future Changes in Atmospheric Temperatures • Mathematical models used for projections • Global warming: rapid rate • Human factors are the major cause of temperature rise over the last 30 years • Always uncertainty with any scientific model
Simplified Model of Some Major Processes That Interact to Determine Climate Fig. 19-A, p. 500
Sun Troposphere Cooling from increase Greenhouse gases Heat and CO2 removal CO2 emissions from land clearing, fires, and decay Aerosols Warming from decrease CO2 removal by plants and soil organisms Heat and CO2 emissions Ice and snow cover Shallow ocean Land and soil biota Long-term storage Natural and human emissions Deep ocean Fig. 19-A, p. 500
Comparison of Measured Temperature from 1860–2008 and Projected Changes Fig. 19-B, p. 501
5.0 4.5 4.0 3.5 3.0 2.5 Change in temperature (°C) 2.0 1.5 1.0 0.5 0 1875 1900 1925 1950 1975 2000 2025 2050 2075 2100 Year Fig. 19-B, p. 501
Individuals Matter: Sounding the Alarm – James Hansen • 1988 appearance before Congress began debate over atmospheric warming • Promoted creation of IPCC • Climate scientist at NASA • Rising levels of greenhouse gases will lead to drastic climate disruption
James Hansen Fig. 19-C, p. 502
CO2 Emissions Play an Important Role (1) • From burning fossil fuels and forests • Abetted by deforestation; forests remove CO2 from the atmosphere • 2010: 389 ppm • 2050: 560 ppm • 2100: 1,390 ppm • 450 ppm as tipping point
CO2 Emissions Play an Important Role (2) • Largest emitters, 2009 • China • United States • European Union (27 countries) • Indonesia • Russia • Japan • India
Cumulative CO2 emissions, 1900-2005 Figure 15, Supplement 9
Waste Heat Also Plays a Role in Climate Disruption • Burning any fuel creates heat • Many sources of heat • Power plants • Internal combustion engines • lights
What Role Does the Sun Play? • Researchers think atmospheric warming not due to an increase in energy output from the sun • Since 1975 • Troposphere has warmed • Stratosphere has cooled • This is not what a hotter sun would do
What Role Do the Oceans Play in Projected Climate Disruption? • Solubility of CO2 in ocean water • Warmer oceans • Last century: 0.32-0.67C°increase • Absorb less CO2 and hasten atmospheric warming • CO2 levels increasing acidity • Affect phytoplankton and other organisms
There Is Uncertainty about the Effects of Cloud Cover on Global Warming • Warmer temperatures create more clouds • Thick, low altitude cumulus clouds: decrease surface temperature • Thin, cirrus clouds at high altitudes: increase surface temperature • Effect of jet contrails on climate temperature
Cumulus Clouds and Cirrus Clouds Fig. 19-8, p. 503
Outdoor Air Pollution Can Temporarily Slow Global Warming • Aerosol and soot pollutants • Will not enhance or counteract projected global warming • Fall back to the earth or are washed out of the lower atmosphere • Reduction: especially in developed countries