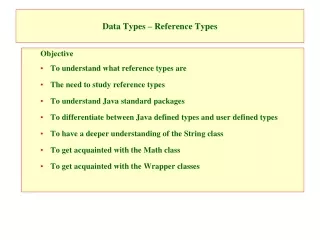
Download
1 / 9
90 likes | 242 Views
Mack T-8 Reference Data. September 8 , 2011 Jim Rutherford. Process. Calculate initial 1004-3 targets and standard deviations arithmetically from all (13) 1998 tests at labs G and J. Apply LTMS V2 up to start of 1005-2 (June 2007)

E N D
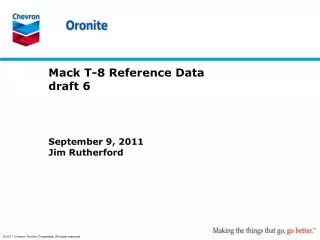
Mack T-8 Reference Data September 8, 2011 Jim Rutherford
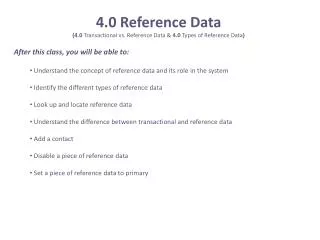
Process • Calculate initial 1004-3 targets and standard deviations arithmetically from all (13) 1998 tests at labs G and J. • Apply LTMS V2 up to start of 1005-2 (June 2007) • Apply severity adjustment from step 2 to 1005 target data set and calculate targets and standard deviations. Using all 1005-2 (10) tests (debatable): • Current Zi = ICF + sa. If sa=0 (debatable): • We could debate what belongs in 1005 target data set and the relationship between ICF and severity adjustments.
Filter Settings - CHART: ( Y)
Filter Settings - LTMSLAB: ( G , J ) - CHART: ( Y)
Filter Settings - LTMSLAB: ( G , J ) - CHART: ( Y)
Filter Settings - CHART: ( Y)
Filter Settings - LTMSLAB: ( G , J ) - CHART: ( Y)
Filter Settings - CHART: ( Y)
Filter Settings - LTMSLAB: ( G , J ) - CHART: ( Y)