Download
1 / 38
380 likes | 479 Views
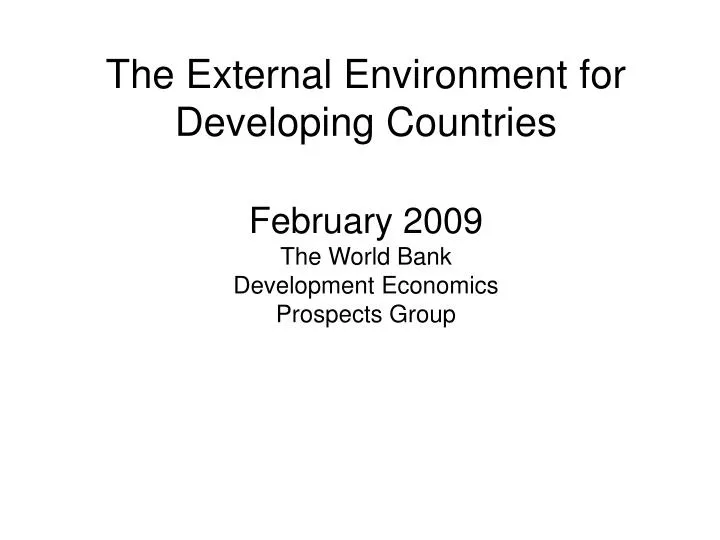
The External Environment for Developing Countries February 2009 The World Bank Development Economics Prospects Group. Sharp contraction in global production. global industrial production, ch% (3m/3m saar). Source: Thomson/Datastream, DECPG.

E N D
The External Environment for Developing CountriesFebruary 2009The World BankDevelopment EconomicsProspects Group
Sharp contraction in global production global industrial production, ch% (3m/3m saar) Source: Thomson/Datastream, DECPG.
Deteriorating credit quality for Emerging Market SovereignsUpgrades minus Downgrades * as of Feb-13, 2009 Source: Bloomberg, EMTA and DECPG Finance Team.
U.S. GDP falls 3.8% in fourth quarteron consumption and investment growth of real GDP, and contributions to growth in percentage points Stocks Government Consumption Investment Net Exports Source: Department of Commerce and DECPG calculations.
4 million persons have joined the jobless queue since start of 2009initial claims for unemployment insurance, weekly, 4week-ma 4-wk moving-avg weekly Source: U.S. Department of Labor.
Retail sales and industrial productionoff to tough start in 2009retail sales and IPmfg, ch% saar Retail sales Production Source: Department of Commerce, Federal Reserve.
Japan GDP plummets 12.7% as exports, capital spending drop sharply in Q4-08growth of real GDP, and contributions to growth in percentage points Government Consumption Investment Stocks Net Exports Source: Japan Cabinet Office and DECPG calculations.
Japan’s trade and production suggest more bad news to comeexport volumes and manufacturing output, ch% saar IP [Left] Export volume [R] Source: Bank of Japan and Japan Cabinet Office.
Labor market, consumer sentiment point to further slide in spendingunemployment rate, cash wage (ch% y/y) [L]; Consumer confidence [R] Unemployment rate [L] Consumer confidence [R] Cash wage (ch%) [L] Source: Japan Cabinet Office.
European recession intensifies to worst in twenty years in Q4-08 GDP growth at seasonally adjusted annual rates Source: EUROSTAT and DECPG calculations.
European exports drop at year-end 2008 export volumes: Germany and France, ch% saar France Germany Source: EUROSTAT through Thomson/Datastream.
Concerns about European banks and weaker member states mountingDAX and CACI Index Jan07=100 [left]; IFO overall [R] IFO overall [R] DAX [L] CACI [L] Source: Thomson/Datastream and IFO.
Sharp contraction in global production with further shrinkage envisaged Industrial production, ch% (3m/3m saar) Forecast Developing countries Global production Source: Thomson/Datastream, DECPG.
GDP contracted in the fourth quarterin emerging economies as well GDP in Russia, ch% (3m/3m saar) Source: DECPG.
A rebound in China’s output growth? Industrial production, ch% (3m/3m saar) Forecast IP NBS PMI Mnf New Exp Orders CLSA/MARKIT PMI:Mnf - Output Source: Thomson/Datastream, DECPG.
OECD imports almost “off a cliff” at year-end 2008 import volumes: U.S., Japan and France, ch% saar Japan France USA Source: National Agencies through Thomson/Datastream.
Imploding East Asia trade export values (USD), ch% saar Korea Japan China Taiwan (PC) Source: National Agencies through Haver Analytics.
Trade balances shift as terms of trade and crisis effects accrue balance of goods trade in local currency: U.S. and Japan Japan [Right] USA [Left] Source: National Agencies through Thomson/Datastream.
Crude oil prices stabilize on OPEC production cuts $/bbl World Bank Average Price Source: Thomson/Datastream and DECPG Commodities Group.
Crude oil inventories still rising on weak demand M bbl 5-year high-low ranges Source: U.S. Department of Energy and DECPG Commodities Group.
Crude price differentials diverge on rising U.S. stocks and OPEC cuts $/bbl WTI Brent Dubai Source: Thomson/Datastream and DECPG Commodities Group.
Food prices rebound in January on supply concerns (2000=100) Source: Datastream and DECPG Commodities Group.
Metals prices stabilize on production cuts Cu $/ton Zn $/ton Copper Nickel Zinc Source: LME and DECPG Commodities Group.
Gold prices rise on safe-haven buying $/toz $/euro Goldprice $/euro Source: Datastream and DECPG Commodities Group.
January capital flows feature a modest revival in bond issuance Source: DECPG Finance Team.
Several BRICs have postedstrong equity gains over 2009 to dateTotal return in LCU, 2009 to date (%) Source: Bloomberg and DECPG Finance Team.
Deteriorating credit quality for Emerging Market SovereignsUpgrades minus Downgrades * as of Feb-13, 2009 Source: Bloomberg, EMTA and DECPG Finance Team.
Dollar continues gains against euromodest upturn vis-à-vis yen USD per Euro (inverse) [Left] and Yen per USD [right] USD/Euro (inverse) yen/USD Source: Thomson/Datastream.
Pro-euro interest differentials narrowas more bullish ECB reponse expected USD Libor and EURIBOR (6 months), percent EURIBOR 6 months USD LIBOR 6 months Source: Thomson/Datastream.
Emerging market currencies largely down vs the dollar over 2009 to datepercentage change (USD per LCU) (%) Source: Thomson/Datastream.
The External Environment for Developing CountriesFebruary 2009The World BankDevelopment EconomicsProspects Group