Download
1 / 31
310 likes | 435 Views
2050. Pathways to Energy & climate change. Pathways to 2050: What it is and what it is not. This p ublication discusses future energy shifts in the context of a long term atmospheric concentration of CO 2 of no more than 550 ppm.

E N D
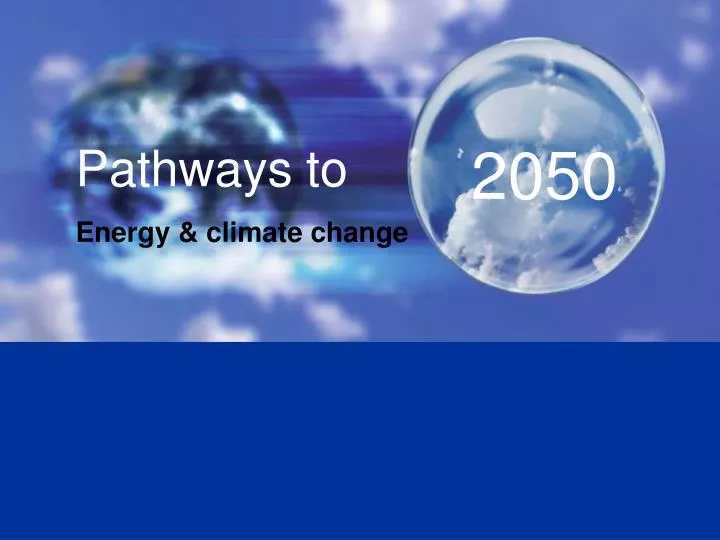
2050 Pathways to Energy & climate change
Pathways to 2050: What it is and what it is not This publication discusses future energy shifts inthe contextof a long term atmospheric concentration of CO2 of no more than550 ppm. The options discussed are not a scenario, but an illustrativehypothesis to gauge the extent of change needed in our energyinfrastructure and the impact that might have on industry. The publication is not an endorsement of any particularpathway, technology or specific atmospheric concentration target.
What is the content? • At a glance: the changes needed Global trends and pathways • Sectoral megatrends • Power generation • Industry & manufacturing • Mobility • Buildings • Consumer choices • Economic regions and countries • USA & Canada • EU-25 • China • Japan
What is the content? • At a glance: the changes needed Global trends and pathways • Sectoral megatrends • Power generation • Industry & manufacturing • Mobility • Buildings • Consumer choices • Economic regions and countries • USA & Canada • EU-25 • China • Japan
Pathways at a glance…Needed reductions Facts & Trends IPCC Scenarios 1000 ppm °C 16 14 6 - Further rises to 2300 2050 6-7 GtC reduction 12 5 - 550 ppm 10 4 - Facts & Trends 9 GtC world 450 ppm 8 3 - 2100 range WRE 1000 (IPCC) WRE 550 (IPCC) WRE 450 (IPCC) 6 2 - 4 13 2 1 - 2025 1.3 GtC reduction 11 Global Carbon Emissions, GtC 2000 2010 2020 2030 2040 2050 9 BAU Pathways to 2050 7 2000 2010 2020 2030 2040 2050 By 2050 we need to have reduced CO2 emissions by 6-7 GtC with 1.3 GtC reduced by 2025, compared with the "BAU" case. Global Carbon Emissions, GtC 1990
What is the content? • At a glance: the changes needed Global trends and pathways • Sectoral megatrends • Power generation • Industry & manufacturing • Mobility • Buildings • Consumer choices • Economic regions and countries • USA & Canada • EU-25 • China • Japan
How does energy flow through our economy? Renewables Oil Biomass Gas Coal Nuclear Primary energy Direct combustion Liquids Electricity Industry & manufacturing Power generation Final energy Buildings Mobility Consumer choices Major energy users Energy Major GHG emitters
One way of representing the challenge: The Kaya Identity The Kaya Identity breaks down the main driving forces for CO2 emissions into four factors, such that: CO2 emissions = people x (GDP/Person) x (energy/unit GDP) x (CO2/unit energy) X X Only four factors govern the outcome: Population Number of people Economic prosperity GDP per person Energy intensity Energy per unit of GDP (energy efficiency of the economy) Carbon intensity CO2 per unit of energy (reflects the emissions from energy production and use)
Illustration of country pathways Linear (2050) 2002 Linear (2002) 2050 400 400 USA & Canada 350 350 300 300 Energy per capita, GJ Energy per capita, GJ 250 250 Japan 200 200 150 150 EU-25 CO2 per energy unit used, t/TJ 100 100 50 50 China $20,000 $40,000 $60,000 $20,000 $40,000 $60,000 GDP per capita, US$ 1995 (ppp) GDP per capita, US$ 1995 (ppp) Countries have to reduce both their energy and carbon intensities, i.e., moving froma high intensity path (yellow) to a low intensity path (blue).
Sectors: The global trends Carbon emissions GtC Land use change Others 10 Power generation 8 Buildings 6 Transports (mobility) 4 Industry & manufacturing 2 0 2002 BAU 2025 Pathways 2025 Pathways 2050 EJ Final energy consumption 400 Others 300 Buildings Transports (mobility) 200 Industry & manufacturing 100 0 2002 BAU 2025 Pathways 2025 Pathways 2050
Where are we? At a glance: the changes needed Global trends and pathways • Sectoral megatrends • Power generation • Industry & manufacturing • Mobility • Buildings • Consumer choices • Economic regions and countries • USA & Canada • EU-25 • China • Japan
What needs to happen in power generation? Milestones by 2025 Commercialized coal powergeneration with carbon capture and storage and have some 100 or more plants in operation globally; Gained full public acceptance of nuclear power as a viable zero-carbon power generation option and restarted long-term growth in this industry. Wind & others Solar EJ Biomass and waste Hydro Nuclear 100 Gas Oil 50 Coal with sequestration Coal without sequestration 0 2002 By 2050 • Natural gas is the largest fossil contibutor to electricity generation; • Hydropower more than doubles until 2050; • Wind, geothermal, wave and tidal power increase nearly 160-fold from 2002; • Coal use grows by 50% and half the generation capacity uses CCS. Electricity generation by fuel BAU 2025 Pathways 2025 Pathways 2050
An important role for electricity BAU Pathways to 2050 60 50 40 30 20 10 0 2002 2025 2050 Shares of electricity in final energy consumption (%) Electricity use is already growing more quickly relative to other energy carriers due to: • Increasing numbers of electrical appliances; • Information technology; • Improvements in electrical applications and a substitution of fossil fuels in end use. Potential role of electricity in a carbon constrained world: • Most renewable technologies generate electricity; • A flexible energy carrier, which produces no emissions at point of use, and offers additional potential for carbon management if generated from low and zero-carbon sources.
Industry and manufacturing: Wide portfolio of measures and options Energy use and emissions levels arerising in industryand manufacturingdue to: • Rising population levels; • Continuing economic growth (e.g., GDPper capita in Chinaincreases by morethan afactor of 7 until 2050). Emissions reduction measures: • Increase the deployment of currently bestavailable technologies (BATs) especially todeveloping countries; • Improve energy efficiency and fuelconservation; • Develop new low-energy and low-carbonintensive technologies; • Shift towards electricity and bio fuels.
Uneven energy intensity in the world 30.6 20 18 16 14 12 MJ/GDP per capita, $US (1995) 10 8 6 4 2 Other Asia Western Europe North America 0 Asia (NIC’s) China Japan Middle East South Asia Latin America Africa Oceania 1980 1990 2002 Energy intensity of industry Source: WEC and ADEME, 2004
Developments in the Mobility Sector 120 100 80 60 40 20 0 Energy consumption in the mobility sector (EJ) Marine bunkers Aviation Rail transport Vehicles / Road transport Trends • Shift towards mass transportation, which is about seven times more efficient than a light duty vehicle; • Need to significantly increase the deployment of highly efficient and hydrogen vehicles; • Growing emissions in the aviation sector due to high demand and absence of a large-scale alternative to current conventional fuels.
What has to change in road transport? Road transport (vehicle-kms, trillions) 2002 2025 2050 22.5 28 13.9 0 5 10 15 20 0 5 10 15 20 25 0 5 10 15 Fuel mix in road transport (%) 100 Hydrogen 25% 80 60 Fossil 40 60% 20 Bio fuels 0 15% 2002 2050 Vehicle distribution (millions) 2000 Hydrogen 500 High efficiency 1000 1100 Conventional 400 0 By 2050 Average vehicle efficiency has increased significantly and emissions from road transport have decreased by nearly 40%.
Megatrend shifts in buildings 2002 Pathways 2050 0.78 GtC (11%) 0.75 GtC (9%) 104 EJ (35%) 237 EJ (43%) Energy use, EJ (% of world total) Carbon emissions, GtC (% of world total) Energy consumption increases due to: Rising living standards; A growing service sector; The information economy; A shift from rural to urban living. Energy consumption and emissions can be reduced by: • Radical design; • Placement; • Efficient appliances; • New materials; • In-situ energy generation.
Towards a zero-energy home Ventilated double skin facades to reduce heating and cooling requirements Wood as a building material withadvantageous insulation properties,which also stores carbon and isoften produced with biomassenergy Rooms that are not normally heated (e.g. a garage) serving as additional insulation Solar photovoltaic panels for electricity production and solar thermal panels for water heating Transparent design to reduce the need for lighting New battery technology for the storage of the electricity produced by solar panels Trees to provide shade and cooling in summer, and a shield against cold wind in winter “Low-E” glass coating to reduce the amount of heat absorbed from sunlight through the windows (windows with the reverse effect can be installed in colder climates) Heat pump systems that utilize the stable temperature in the ground to support air conditioning in summer and heating or hot water supply in winter
The power of consumer choices Consumer choices as a cross-cutting trend affect all the other megatrends. Today: • Energy characteristics of goods and services hardly affect our consumer choices; • Lack of consumer awareness regarding energy and carbon issues. By 2050: • Society has understood that their choices affect the energy balance; • The energy impacts of our choices become completely transparent; • Products will have a low-energy and low-carbon value. The different choices we make today can significantly affect our carbon footprint Two families, two footprints (tons of carbon p.a.) Household 4.09 Car travel 2.20 Air travel 3.11 Waste 0.25 Total: 9.65 Household 0.20 Car travel 0.23 Air travel 0.32 Waste 0.10 Total: 0.85 Source: BP carbon Calculator
2050: What has happened? The industry and manufacturing sector has further improved its efficiency; The mobility sector has nearly doubled its vehicle efficiency, adapted a broader range of fuels, and balanced private and mass transportation; The building sector has significantly enhanced its energy efficiency to partly offset rising energy demand; Consumers are fully aware that their every day choices affect the energy balance. • The power sector supplies low-carbon electricity from a wide variety of energy sources. Electricity use has increased significantly;
Where are we? At a glance: the changes needed Global trends and pathways • Sectoral megatrends • Power generation • Industry & manufacturing • Mobility • Buildings • Consumer choices • Economic regions and countries • USA & Canada • EU-25 • China • Japan
USA and Canada: Efficient and growing Energy per capita, GJ 400 2002 1990 350 Pathways 2025 1971 300 Pathways 2050 CO2 per energy unit used, t/TJ 250 GDP per capita, $US (1995 ppp) 0 $0 $10,000 $20,000 $30,000 $40,000 $50,000 $60,000 $70,000 Milestones by 2025 • Carbon emissions in decline, particularly from the transport sector; • Nuclear power capacity maintained at 2000 levels; • Over 70 coal-fired power stations with CCS; • 50% improvement in vehicle efficiency and two million hydrogenpowered vehicles on the road; • Bio-fuel use well established and meeting +10% of the vehicle fuel mix. By 2050 • Robust growth with little increase in energy demand; • A transformation in the transport sector; • Coal-fired power generation based largely on CCS; • Nuclear power use up 40%; • Large scale use of renewables.
USA and Canada: Exploring economic trade-offs 70 Focus on energy efficiency, little decarbonization 60 50 40 Focus on decarbonization, little improvement in efficiency 30 2050 options, constant carbon 20 10 0 12 14 0 2 4 6 8 10 Balanced and optimized approach has been chosen CO2 per unit of energy, tCO2 / terajoule 1990 2002 Energy per GDP, MJ per $ Two extreme pathways, same carbon curve: • Energy efficiency improvements, no decarbonization Decarbonization, no energy efficiency improvements
EU-25:A broad based energy infrastructure Energy per capita, GJ 2002 180 Pathways 2025 1990 160 Pathways 2050 1971 140 120 CO2 per energy unit used, t/TJ 100 0 $0 $10,000 $20,000 $30,000 $40,000 $50,000 $60,000 GDP per capita, $US (1995 ppp) Milestones by 2025: • Some 30+ large generating stations using CCS; • Natural gas use up 35% from 2002; • A restart in nuclear power growth; • Rapid growth in renewable energy: wind power some 10-15 times the 2002 level; • Vehicle efficiency improves by nearly 50%. By 2050: • Overall reduction in primaryenergy demand; • Electricity becomes the mainend-use energy source; • A broad based energy mix,including nuclear; • Petroleum / bio-fuel / hydrogenmix in the transport sector; • Large scale use of renewables.
EU-25:The "decarbonization challenge" Final Energy Electricity Liquids Gas Solids 2 EJ per year solar 50,000 5MW wind turbines 100 1GW coal power stations 100 1GW coal stations with sequestration 100 1GW oil power stations 100 1GW biomass or waste stations 100 1GW gas power stations 100 1GW nuclear plants 100 1GW hydro/ tidal /geothermal 50 million vehicles 50 million efficient vehicles (Zero CO2) 10 EJ direct fuel use
China: A low-carbon, coal-based economy Pathways 2025 Pathways 2050 Milestones by 2025: • Gasification as the standard for coal-based power generation (with CCS starting); • Tough energy efficiency standards in place for all buildings; • 10 fold expansion in nuclear power generation vs. 2002; • Wind and solar deployment becomes significant; • Continued tightening of vehicle efficiency standards and hydrogen infrastructure being developed. By 2050: • Heavy reliance on coal forpower, but 50% using CCS; • Large scale use of renewables,dominated by wind; • Nuclear as a mainstreamsource of power; • High-efficiency vehicle fleet(~350 million) - 6 litres/100 km; • Sustainable biomass practices. Energy per capita, GJ 125 100 75 CO2 per energy unit used, t/TJ 50 1990 1971 25 2002 0 GDP per capita, $US (1995 ppp) $0 $10,000 $20,000 $30,000 $2,000 $4,000 $6,000 $8,000
China:Fast evolving energy infrastructure Final Energy Traditional biomass Solids Liquids Gas Electricity 5 EJ per year solar 100,000 5MW wind turbines 200 1GW coal power stations 200 1GW coal stations with sequestration 200 1GW oil power stations 200 1GW biomass or waste stations 200 1GW gas power stations 200 1GW nuclear plants 200 1GW hydro/ tidal /geothermal 100 million vehicles (Zero CO2) 100 million efficient vehicles (Zero CO2) 10EJ non-commercial fuel 20 EJ direct fuel use (Biomass)
Japan: A sustainable showcase economy Energy per capita, GJ 2002 200 Pathways 2025 1990 Pathways 2050 150 1971 100 CO2 per energy unit used, t/TJ 50 GDP per capita, $US (1995 ppp) 0 $0 $10,000 $20,000 $30,000 $40,000 $50,000 $60,000 Milestones by 2025: • A 50+% reduction in coal-fired power generation; • Sustained growth re-established in the nuclear sector; • Thin-film solar commercialized in building use (roofing/cladding); • Commercial hydrogen generation and use in transport with ~20% market share; • 50% improvement in vehicle efficiency and two million hydrogen vehicles on the road. By 2050: • Coal-fired power generationphased out; • Nuclear at double 2002 levels; • Distributed solar generation; • All vehicles on the road are hydrogen powered; • A further step change in the energy efficiency of the economy.
In summary: The features of a 550ppm trajectory Power generation: More than 100 CCS facilities are in operation. Coal use grows by 50% compared to 2002, and half of the capacity uses CCS. Mobility: Around 375 million high-efficiency vehicles are on the road. Predominantly high efficiency vehicles with a wide fuel mix. EU-25: « Wind and others » being 10-15 times the 2002 level. « Wind and others » being the largest power generation source. China: Nuclear power capacity increases nearly 10-fold to 2002. Nuclear generation capacity as big as EU and North America combined today. Japan: Energy use per GDP unit has fallen from 7 MJ/$ to 4.2 MJ/$. Energy efficiency continues to improve by more than 2% a year. By 2025: By 2050: Examples
A range of existing technologies and policies, further developed and deployed can deliver a 550 ppm trajectory, but… . . . the scale of change is immense, . . . . .and we need to act now!