Download
1 / 36
440 likes | 713 Views
Rheology of granular mixtures. Advisor: Professor Kimberly M. Hill In collaboration with William E. Dietrich and Leslie Hsu. Bereket Yohannes Department of Civil Engineering, University of Minnesota. Funding: NCED and NSF-CBET-0756480. National Center for Earth-surface Dynamics: Web Seminar

E N D
Rheology of granular mixtures Advisor: Professor Kimberly M. Hill In collaboration with William E. Dietrich and Leslie Hsu Bereket Yohannes Department of Civil Engineering, University of Minnesota Funding: NCED and NSF-CBET-0756480 National Center for Earth-surface Dynamics: Web Seminar March 25, 2010
Outline • Motivation: bouldery debris flows • Theory: rheology of dense sheared granular flows • Numerical simulations: distinct element method • Granular flows in rotating drums: • “model debris flows” • Granular flow in simple systems: Couette flow • Future plans
Motivation • Debris flows in nature Illgraben, Switzerland (Courtesy: WSL, 2006 )
Motivation: bouldery debris flow • Gravity driven flow of particles + fluids • Particles: small sediments to large boulders • Fluids: typically water and little/no mud • Debris flows grow from small perturbations to massive movement via particle entrainment and bedrock erosion. • Boundary stresses (normal & shear) are important for predicting the magnitude of damage and entrainment.
Motivation Basic features: • Wide particle size distribution • Segregation due to particle size distribution: large particle segregate to the front and form the snout • Spatial variation in boundary stresses • Pore pressure effect • Saturated granular flow • Excess hydrostatic pressure (undrained conditions) • Fine particles • Fast deformation • Reduction in effective stresses and increased mobilization.
How do these basic features affect the rheology of granular flows? Phase I • How does the particle size distribution influence the boundary stresses?
Debris flow models I • Some examplesof debris flow models • Bingham fluid model [Johnson, 1970] • Predicts plug flows in muddy debris flows • Herschel-Bulkley fluid model [Michaels et al, 1962] • Accounts for shear thinning behavior of muddy debris flows • Frictional models for shallow granular flows [Savage and Hutter, 1989; Iverson, 1997] • Accounts for basal friction and pore pressure effects
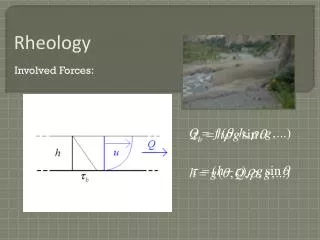
Theoretical models for stresses in granular flows ‘Grain inertia’ dominated flow [Bagnold, 1954] Based on momentum transfer due to particle collision p σ du dy Debris flow models II n= Concentration d = particle size P = normal stress t = shear stress (Takahashi, 1978, 2007; Stock and Dietrich, 2006; Hsu et al, 2008)
Bagnold’s rheology for mixed grain size? (Courtesy: WSL, 2006 ) • Bagnold’s model does not account for particle size distribution • Use the median particle size for narrow particle size distribution [Takahashi,1981] • Use local median particle size [Stock & Dietrich, 2006]
Model debris flow experiments • Granular flows in rotating drum (@University of California, Berkeley) • To study stresses at the boundary and the associated erosion • Bigwheel: 4 m x 0.8 m • equipped with force sensors • 500Hz sampling rate • Maytag: 0.56 m x 0.15 m • erodible bed (Hsu et al. 2008) Big wheel Maytag [Experiments by Hsu and Dietrich, University of California @Berkeley]
t n δn Distinct element method (DEM) [Cundall and Strack, 1979] [Tsuji et al., 1992] • Advantages: • First principle particle-particle interaction • Particle size distribution can be directly represented in the coefficients • Example:
Validation of simulations with rotating drums R=0.28 m d=13.8mm W=12 rpm [Experiments by Hsu and Dietrich, University of California @Berkeley] Thin granular flows Representative of debris flows fronts
Experiment-simulation comparison Longitudinal surface profile (d=13.8mm particles) Black = simulation Orange = experiment
0.2 50 mm 0.1 P(θ) 0 0.2 40 mm P(θ) 0.1 0 0.2 34 mm P(θ) 0.1 P(θ) 0 0.2 25 mm 0.1 P(θ) θ -10 0 10 20 30 0 θ (deg) θ (deg) θ (deg) Experiment-simulation comparison • Experiments and simulations for mass = 3.13 kg • Size of matrix particle = 13.8 mm • Single intruder particle Position of intruder particles simulation experiment
Experiment-simulation comparison *4Fq(°)experimentsimulation0.100.050806040200 • Experiments in BigWheel • Simulations in MayTag The forces in the simulations compare well with results of experiments.
1º Average normal forces on drum bed Summation of all normal contact forces averaged over 3 minutes Total weight of particles = 4.2kg; d =13.8mm 0o Drum diameter = 56 cm Drum width = 15 cm ‘bin bed area’= 7.33 cm2 The average normal forces follow the shape of the surface profile
Average normal forces on drum bed Average normal force for 50 mm intruder particles • The average normal forces follows the shape of the surface profile • The magnitude of the average force remains same even with increase of number of intruder particles
Maximum normal forces on the drum bed Maximum normal contact forces measured in a bin during the entire simulation period. • Large forces at the flow front • The maximum force increases with number of intruder particles
Complications for rotating drum flow y (mm) y (mm) • Kinematics varies in the stream-wise direction • particle segregation from front to back of flow • variation in velocity profile, concentration, thickness of flow • The variation inhibits systematic study of rheology • A simpler boundary condition will be helpful to study some details of rheology
Couette flow simulations Cell dimensions Length (L) = 288mm Height (H) = 160mm Width (W) = 50mm & 150mm Constant volume simulation Size of particles Small particles = 10mm +/- 1mm Large particles = 20mm +/- 2mm Glued particles (roughness) • Shear rate = 3.44 – 19.5 s-1 • Total volume fraction = 0.568 (constant volume simulations) Yohannes and Hill, 2010 Hill and Yohannes, submitted, 2010
Particle segregation is limited After 200 s • The concentration of large particles slightly increases in the middle region and reaches a steady state quickly.
Couette cell flow Velocity profile eg. fL=0.25, shear rate = 3.46 s-1 Volume fraction (after 18 s) • Linear velocity profile (uniform shear rate) • Limited particle segregation • The effect of particle size distribution on boundary stresses can be studied in isolation.
Y x H Uw Boundary stresses • Couette cell Cell dimensions Length (L) = 288mm Height (H) = 160mm Width (W) = 50mm & 150mm Glued particles = normal stress = shear stress
Boundary stresses Normal stress measured at the boundary (frequency of measurement = 450 Hz) fL=0.0 fL=0.25 Uw= 550 mm/s
Boundary stresses Probability distribution function of the normal stress fL=0.0 fL=0.25 -Resembles lognormal distribution (Yohannes and Hill, 2010)
Boundary stresses fL slope =2.0 -For a given mixture the mean normal stress increases as a square of the shear rate. - Bagnold’s model:
Normal stress for several fL Shear rate=3.44 s-1 -The relationship between average particle size and mean stress is non-monotonic - Bagnold’s model: p~d2
Y x H Uw Glued particles “packing” in sheared granular mixtures constant pressure simulations AP = 17.2kPa Applied pressure • Normal stresses in constant volume Couette flow can be related to the efficiency of packing of the mixtures.
Packing efficiency and coordination number For jamming transition in granular flows the free volume per particle is inversely proportional to number of contacts per particle (coordination number ) (Atse et al., 2006; Song et al., 2008) W = free volume per particle Vg =volume of particle Z = coordination number
Coordination number and boundary stresses The coordination number follows the same trend as the normal stresses
Relationship between p and Z - Z alone cannot explain the scaling of boundary stresses due to sheared granular mixture flows.
p σ du dy Revisiting Bagnold’s hypothesis
p σ du dy Revisiting Bagnold’s hypothesis slope = 1.0 (Hill & Yohannes, submitted, 2010)
Summary • We used DEM simulations and experiments to study the rheology of sheared granular mixtures. • In a simple Couette flow, the boundary stresses scale with and some measure of packing efficiency. • In free surface flows (eg. debris flows and drums) • Boundary stresses increase with particle size • Systematic study is difficult • Next step: test model for stresses in debris flows and rotating drums.
Future direction • Test new rheology model in ‘model debris flow’ (rotating drums) • average stresses • Std. dev. of stresses • Other statistical measures • Phase II: Add fluid effects (pore pressure) to DEM simulation and rheology model • How do these influence boundary stresses? • Ultimately link boundary stresses with bed rock erosion parameters