Download
1 / 6
60 likes | 186 Views
This document explores the 5 Number Summary and identifies any outliers from the dataset related to the Hispanic population in Brooklyn. The 5 Number Summary includes Minimum = 5%, Q1 = 8%, Median = 14%, Q3 = 27%, and Maximum = 80%. Additionally, we will construct a Box-Plot based on this summary, revealing insights into the distribution characteristics of the population percentages across neighborhoods such as Sunset Park and Bushwick. We will also highlight outliers at 64% and 80%, which may signify significant deviations.

E N D
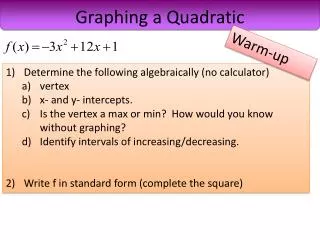
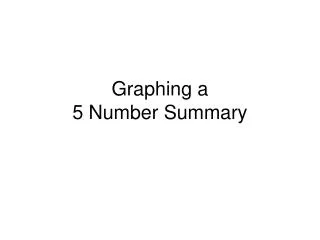
Do Now:Find the 5 Number Summary and any Outliers for the following:
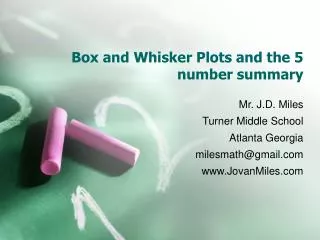
Construct a Box-Plot from the following 5 Number Summary: 3 5 11 13 20
Lowest = 5 % IQR 27% - 8% Q1 = 8 % 19 % 19 % • 1.5 Median = 14 % 28.5 % 8% - 28.5% = - 20.5% 27% + 28.5% = 55.5% Q3 = 27 % Outliers: 64% and 80% Highest = 80 %
5 Number Summary5% 8% 14% 27% 54% Outliers 64% and 80% SunsetPark Bushwick 100% 80% 0% 20% 40% 60%