Download
1 / 24
240 likes | 386 Views
DGMonitor: a Performance Tool for Monitoring Resources on Sandbox-based Desktop Grids. M. Taufer , P. Cicotti, A. Chien. Cluster of PCs. Desktop grid. Cray C90. Search for More Cost-Effective Computing Resources. Late 80s. Middle 90s. Early 2000. time.

E N D
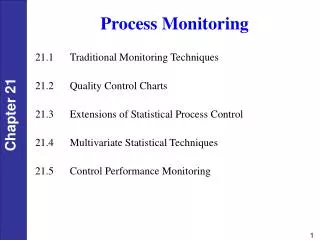
DGMonitor: a Performance Tool for Monitoring Resources on Sandbox-based Desktop Grids M. Taufer, P. Cicotti, A. Chien PMEO-PDS’ 2004 04/30/2004
Cluster of PCs Desktop grid Cray C90 Search for More Cost-EffectiveComputingResources Late 80s Middle 90s Early 2000 time Desktop grids By scavenging for available and idle cycles, they provide computing power at a significant cost savings PMEO-PDS’ 2004 04/30/2004
Heterogeneous and Volatile Computing Environment Internet/Intanet PMEO-PDS’ 2004 04/30/2004
prevent malicious attacks sandboxes Sandboxing Techniques Internet/Intanet PMEO-PDS’ 2004 04/30/2004
Challenge in MonitoringSandboxed Applications • For the sake of performance and scalability: • Discovery of resources among volatile nodes • Selection of resources based on real information at runtime • On sandbox-based desktop grids, the continuous monitoring of real resources is a challenge: • Physical and virtual environments do not correspond • Sandboxes are reset at each task termination • Engineering of the sandbox with sensors is not always possible DGMonitor as a tool for building an accurate and continuous view of resource usage for desktop grids based on sandboxing techniques PMEO-PDS’ 2004 04/30/2004
Outline • Taxonomy of applications on desktop grids • Monitoring resource availability • Architecture of DGMonitor for Entropia desktop grid • Critical implementation issues • System evaluation • Local overhead • Scalability of DGMonitor • Further research opportunities PMEO-PDS’ 2004 04/30/2004
Taxonomy of Applications on Desktop Grids • Each application consists of a large number of independent tasks with long turn-around time • e.g., hours, days • Total task execution can be decomposed into distinct activities • e.g., computation, communication, accessing data on local devices • Each activity is largely characterized by the usage of one single critical system resource • e.g., CPU, disk, network PMEO-PDS’ 2004 04/30/2004
100 50 0 Monitoring Resources Usage • Host availability: yes availability no time • Resource availability (CPU, memory, etc.) CPU availability time PMEO-PDS’ 2004 04/30/2004
Advantages of DGMonitor • No existing tools support desktop grids based on sandboxes as DGMonitor does • Tools like VAMPIR, SVPablo, and Paradyn need: • Re-engineering, re-compiling or re-linking of the application • Embedded operating system or middleware instrumentation • Tools like NWS or Ganglia require: • Handling sensors on local machines • Maintenance of two separate infrastructures desktop grid platform and monitoring tool infrastructures PMEO-PDS’ 2004 04/30/2004
sandbox application.exe output output output input input application.exe job submitter run.vbs run.vbs scheduling server worker Entropia DCGrid Job submission: Job execution: PMEO-PDS’ 2004 04/30/2004
application mLauncher pinholes mStarter mDaemon Architecture of DGMonitor Our monitoring tool has a master-worker setting monitored worker monitoring master sandbox Entropia channel resources PMEO-PDS’ 2004 04/30/2004
files pinholes database display mController mCollector data mDaemon control Architecture of DGMonitor Our monitoring tool has a master-worker setting monitored worker monitoring master sandbox Entropia channel resources PMEO-PDS’ 2004 04/30/2004
Critical Issues • Metrics: what information to capture resource usage • Data sampling: when to measure the status of resources • Data collection: how to collect distributed information • Global notion of time: how to fit distributed data in a global time framework • Monitoring intrusiveness: how monitoring affects the monitored system / applications • Scalability: what size for our monitoring tool PMEO-PDS’ 2004 04/30/2004
System Metrics • Each desktop PC as a set of networked resources • i.e., CPU, memory, storage devices, network • Each resource is represented by a set of metrics PMEO-PDS’ 2004 04/30/2004
Taxonomy of the Sampling • Coarse granularity samples for long time simulations • Daemon samples resources based on: • Time thresholds(t, t with 1sec <= t << t) • Resource thresholds( r ) • mDaemon sends metrics to mCollector if: • To facilitate the accurate rebuilding, samples are send every t • Proper values for the time and resource thresholds depend on the system and the application PMEO-PDS’ 2004 04/30/2004
Communication Policy Data channel • mDaemon mCollector : to send resource samples Control channel • mDaemon mController : to register and keep the lease renewed • mDaemon mController : to send time and resource thresholds, to renew lease PMEO-PDS’ 2004 04/30/2004
Communication Protocols • Adverse effects of the monitoring data traffic by using the UDP/IP protocol for the collection of samples • Fast transmission protocol • No connection states are maintained support for large number of workers • No attempt to re-transmit lost messages • Regression models to rebuild lost information • Assure reliable control of the monitoring master over the workers by using the TCP/IP protocol • Control messages are not frequent PMEO-PDS’ 2004 04/30/2004
mDaemon survives the reset of sandbox but violates the obtrusiveness principle of sandboxing techniques Ensuring Self-Cleaning by Using a Lease Policy • At regular intervals T, mDaemon requests renewal of its lease to mController • mController validates mDaemon continues its sampling • mController does not validate mDaemon terminates Critical conditions: • Network or mController failure mDaemon does not succeed in renewing the lease and expires • mDaemon failure no attempt to resume mDaemon PMEO-PDS’ 2004 04/30/2004
Global Notion of Time Notion of global time using virtual synchronizations based on Christian’s algorithm worker master Request renewal re-synchronization of sampling time on worker Renewal acknowledgment PMEO-PDS’ 2004 04/30/2004
System Evaluation System characterization • Multi-threaded packet generator to emulate large number of monitored workers • performance data in packets of 128 bytes • Two different master configurations: • 400 MHz CPU, 256 MB memory, slower disk • 2 GHz CPU, 512 MB memory, faster disk Local overhead • Intrusiveness percentage on single worker due to monitoring Scalability study • Maximum number of mDaemons that mCollector can serve per second without loosing performance data PMEO-PDS’ 2004 04/30/2004
Local Overhead System characterization • Different monitoring thresholds (t , t, r) • Dedicated PCs Measurement of intrusiveness on monitored workers • The local overhead is light and less than 1% for repeated tests over long running times with: t = t = 1 sec maximal sampling frequency PMEO-PDS’ 2004 04/30/2004
Scalability for Different Master CPUs Collected performance data are saved in local files on the master: 2GHz CPU 400MHz CPU Packets received/sec Packets sent/sec The master can handle up to 12000 performance packets per second sent in real time by independent workers PMEO-PDS’ 2004 04/30/2004
Remote DB Local DB Remote DB provides better scalability but data are stored with some delay due to congestion control of TCP Scalability for Different Database Repositories The faster master (2GHz) is used to collect performance data: Packets received/sec Packets sent/sec PMEO-PDS’ 2004 04/30/2004
Summary and Future Work • DGMonitor builds a global, accurate, and continuous view of real resource utilization for desktop grids with sandboxing • DGMonitor scales to large desktop grids (up to 12000 workers) with low monitoring overhead (less than 0.1% resource consumptionon monitored PCs) Work on progress • Addressing accuracy of performance data collected • Integration of DGMonitor into other desktop grid platforms i.e., XtremWeb • Use of DGMonitor to address the resource requirements of applications at runtime PMEO-PDS’ 2004 04/30/2004