Essential ArcPlot Commands for Effective Data Management in GIS
This guide explores crucial ArcPlot commands for selecting and summarizing data within GIS contexts. It covers methods to meet specific conditions, such as reselecting, nselecting, aselecting, and unselecting records. The description also highlights how to determine the characteristics of features and perform limited statistical operations using POEC 6382 Applied GIS Software. Emphasizing coverage query techniques, maintenance, conversion, and spatial analysis methods, this document serves as a comprehensive resource for manipulating coverages and answering research questions via ArcInfo-based GIS.

Essential ArcPlot Commands for Effective Data Management in GIS
E N D
Presentation Transcript
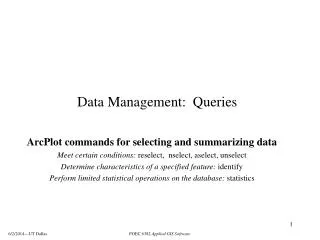
Data Management: Queries • ArcPlot commands for selecting and summarizing data • Meet certain conditions: reselect, nselect, aselect, unselect • Determine characteristics of a specified feature: identify • Perform limited statistical operations on the database: statistics POEC 6382 Applied GIS Software
Overview • The manipulation of coverages lies at the heart of ArcInfo-based GIS • The methods or commands are numerous and can be classified in many ways • There is always overlap, but basic groupings are • Coverage Query: techniques for querying existing coverages (see query.ppt) • Coverage Maintenance: creating, maintaining and modifying coverages (see covergages.ppt) • Coverage Conversion: converting from one GIS format or data model to another (see convert.ppt) • Spatial Analysis: manipulation of coverages to answer some research question or achieve some operational purpose (see analysis.ppt) • Spatial analysis techniques may be used for coverage query anmd maintenace also • We will discuss Query and Maintenance in the context of Workstation ArcInfo. • query.ppt • coverage.ppt ArcToolbox includes these in its Data Management component • We will cover the Conversion and Spatial Analysis commands in the context of ArcToolbox, • Conversion.ppt • Analysis.ppt POEC 6382 Applied GIS Software
SPATIAL QUERIES • ARCPLOT commands which allow the user to display and query spatial data. • Determine available data: • items • list • Meet certain conditions • reselect • nselect • aselect • unselect • Determine characteristics of a specified feature • identify • Perform limited statistical operations on the database • statistics POEC 6382 Applied GIS Software
Spatial Queries: Selecting Records When you select a table, or draw a coverage in ArcPlot, all records are contained in the active set and any commands executed will affect all the records in the table. To modify specific records, you need to place records in a subset: • RESELECT - selects a subset of records from the currently selected data set using a variety of methods -- see usage for reselect in ARCPLOT. Most popular: logical expression, graphical (box, circle, etc), and overlap. • ASELECT – when issued with logical expression, selects additional records to add to selected set -when issued alone, selects all records • UNSELECT - removes features that match a logical expression • NSELECT - switches the set of selected and unselected records. • CLEARSELECT - clear the selected set -- not automatic, must clear the selected set prior to reselecting another set unless only want a record from the currently selected set. • WRITESELECT - write the selected set into a selection file which can be read later or used to create a new coverage in ARC. • READSELECT - will read a set specified with the writeselect command This is critical. Normally issue before every reselect! POEC 6382 Applied GIS Software
RESELECT • Arcplot: usage reselect • RESELECT <cover> <feature_class> {logical_expression} • RESELECT <cover> <feature_class> ONE <xy | *> • RESELECT <cover> <feature_class> MANY <xy...xy | *> • RESELECT <cover> <feature_class> BOX <xmin ymin xmax ymax | *> {PASSTHRU | WITHIN} • RESELECT <cover> <feature_class> POLYGON <xy...xy | *> {PASSTHRU | WITHIN} • RESELECT <cover> <feature_class> CIRCLE <xy radius | * {radius}> {PASSTHRU | WITHIN} • RESELECT <cover> <feature_class> MAPEXTENT • RESELECT <cover> <feature_class> PARTIAL • RESELECT <cover> <feature_class> KEYFILE <info_key_file> <item> {KEYITEM <key_file_item>} • RESELECT <cover> <feature_class> KEYFILE <cover> <feature_class> <item> {KEYITEM <key_file_item>} • RESELECT <cover> <feature_class> OVERLAP <overlap_cover> <overlap_feature> {selection_distance} {PASSTHRU | WITHIN} POEC 6382 Applied GIS Software
RESELECT, continued • RESELECT <cover > <feature_class> RANDOM <number> {PERCENT} {seed} • RESELECT <info_file> INFO {logical_expression} • RESELECT <info_file> INFO KEYFILE <info_key_file> <item> {KEYITEM <key_file_item>} • RESELECT <info_file> INFO KEYFILE <cover> <feature_class> <item> {KEYITEM <key_file_item>} • RESELECT <info_file > INFO RANDOM <number> {PERCENT} {seed} • RESELECT <image_catalog> IMAGE {logical_expression} • RESELECT <image_catalog> IMAGE ONE <xy | *> • RESELECT <image_catalog> IMAGE MANY <xy...xy | *> • RESELECT <image_catalog> IMAGE BOX <xmin ymin xmax ymax | *> {PASSTHRU | WITHIN} POEC 6382 Applied GIS Software
AND OR Logical Expressions EQ LE NE CN GT NC GE IN LT LK Item name Character string* numeric value Item name operand Equals, not equal to, greater than, greater than or equal to, less than, less than or equal to, contains, not contains, in a range of values, like Must have a space on each side of the operator, even when using equal (=) symbol e.g. State = ‘TX’ *Must be in ‘single quotes’ (And must use key next to Enter key) operator
Examples • Select from coverage USA polygon features for the State of Texas: • RESELECT <cover> <feature_class> {logical_expression} • reselect usa poly state = ‘TX’ (reminder:Character strings are always in single quotes) • RESELECT <cover> <feature_class> POLYGON <xy...xy | *> {PASSTHRU | WITHIN} • reselect usa poly polygon * within (drag cursor box around Texas) • RESELECT <cover> <feature_class> OVERLAP <overlap_cover> <overlap_feature> {selection_distance} {PASSTHRU | WITHIN} • reselect usa poly OVERLAP texas poly (already have a cover named texas) • Find all buildings within 100’ of a stream • RESELECT <cover> <feature_class> OVERLAP <overlap_cover> <overlap_feature> {selection_distance} {PASSTHRU | WITHIN} • reselect bldg poly overlap stream line 100 (assumes mapunits are in feet) • REMEMBER: Once you have selected a set, all future commands act only on the selected set. To clear the selected set use the command CLEARSELECT. POEC 6382 Applied GIS Software
Saving Selected Sets: writeselect v. new coverage In ArcPlot (be sure to see big difference between Arc and ArcPlot use of reselect) • Select records from coverage: Arcplot: reselect <cover> <feature class> {logical selection} Arcplot: reselect usa poly state eq ‘TX’ • Create a selection file for this selected set Arcplot: writeselect <selection_file> {<cover> <feature class>} Arcplot: writeselect texas.sel Arcplot: quit This will create a selection file containing all current selection criteria (but no data records). Use readselect to read this selection file another time to re-establish these criteria. In Arc Use reselect command in Arc to create new coverage Arc: reselect <in_cover> <out_cover> {in_feature class} {selection file} {out_feature class} Arc: reselect usa texas poly texas.sel poly This will create a new coverage containing actual data records. Similar to “Convert to Shapefile” in ArcView. However, rarely need to create a new coverage -- use an AML to reselect your records in ArcPlot, or readselect a writeselected set. POEC 6382 Applied GIS Software
READSELCT • reads a previously created selection file and re-establishes the selected record set based on the selection file contents. • READSELECT <selection_file> • For example, the following reads an existing selection file, which is assumed to select only Oklahoma counties, so that the map extent will be limited to Oklahoma rather than all US and only Oklahoma will appear on the map. (uscnty is a coverage) readselect okcnty.sel mape poly uscnty polys uscnty POEC 6382 Applied GIS Software
Retrieving Information About your Data The IDENTIFY command allows you to point at a coverage feature and display its attributes. Usage: identify <cover> <feature_class> <xy | *> Arcplot: identify site polys * Enter point Record AREA PERIMETER PARCEL# PARCEL-ID PIN 17 2432.473 901.877 23 23 21392904 If you only want IDENTIFY to list one or more items, specify item names: Arcplot: identify site polys * area pin Enter point Record AREA PIN 17 2432.473 21392904 POEC 6382 Applied GIS Software
Statistics • STATISTICS generates summary statistics from items in an INFO data file and may save them to a new INFO data file. Usage here is for ArcPlot. • Use STATISTICS to determine SUM, MEAN, MAXIMUM, MINIMUM, or STANDARD DEVIATION for an item or items in a Tables data file. • STATISTICS <cover> <feature_class> {case_item} {out_info_file} • Case-Item is NOT the variable for which you want statistics. It is a grouping (BY) variable. • Separate statistics are produced for each set of records with same value on this variable. • Variable(s) for which you want stats are named within the dialog (see next slide) • Be sure you have the desired “selection set” of records before requesting statistics • Arcplot: statistics europe polys • Since no {case_item} is specified, one set of statistics is calculated using all currently selected records. • Arcplot: statistics streets arcs street-name streets.sta • For each unique value of street-name {case_item}, summary statistics are calculated and placed in the streets.sta {output_file}. • Arcplot: statistics aircover points # aircover.sta • Since no {case_item} is specified, one set of statistics is calculated using all currently selected records and saved in the file aircover.sta POEC 6382 Applied GIS Software
Statistics exampleIn this example, you have a polygon coverage europe containing a variable (item) area for which you want stats.No {case-item} or {output file} is used. Arcplot: statistics europe polys Enter statistical expressions. Type END or blank line to end. Statistics: sum area Statistics: mean area Statistics: max area Statistics: min area Statistics: end 1 FREQUENCY = 87 SUM-AREA = 1721234.892 MEAN-AREA = 21671.100 MAX-AREA = 202398.519 MIN_AREA = 675.325 POEC 6382 Applied GIS Software