Richard White
1.17k likes | 1.39k Views
Biodiversity Informatics. Richard White. Part One. An introduction to biodiversity data. Outline. Biodiversity: what is it? Definitions: is biodiversity: A resource? Something which can be measured? How to measure it Who is it for? Data providers Researchers Users

Richard White
E N D
Presentation Transcript
Biodiversity Informatics Richard White
Part One • An introduction to biodiversity data
Outline Biodiversity: what is it? Definitions: is biodiversity: A resource? Something which can be measured? How to measure it Who is it for? Data providers Researchers Users Biodiversity Informatics Research into techniques for handling data
Threats to the planet Human activities Economics Habitat conservation Ecology Ecological diversity Exploitation Conservation Management Species diversity Evolution Species conservation Information services Genetic diversity Genetics Genetic resources Molecular biology Legal issues
Biodiversity data types Kinds of biodiversity information: Data about areas, habitats, etc. Data about individual specimens Data about species Biodiversity data dimensions Species Diverse information types Descriptive, geographical, chemical, genomic etc.
Data about areas, habitats, etc. Species lists, for Conservation Management Legal obligations Ecological processes Modelling ecosystems Predicting impacts
Information about individual specimens Curatorial data about the management of each specimen Data describing characteristics of the specimen itself (which can also describe an entire species)
Curatorial information Collection event Date and place of collection Collector’s name Identifications (determinations) Species name (see data about individual specimens and species) Who identified it, date, etc. Management information Location within the specimen collection (storage) Treatments given to specimen, etc.
Data about specimens and species curatorial data nomenclatural data descriptive data geographical data, maps images bibliographic data
Data describing specimens and species (1) Genetic diversity Allele and chromosome frequencies Molecular bioinformatics Molecular data – enzyme properties, etc. Molecular sequences – DNA, protein, polysaccharides, etc. “Traditional” data used in taxonomy etc. See next slide
Data describing specimens and species (2) Nomenclature – accepted name, synonyms Taxonomy – higher taxa Geographical data – distribution (range) Chemical constituents (especially in plants) Behavioural information (animals) Descriptive data Anatomical and morphological descriptors Images Bibliographic data (source references, especially for species data)
Geographical data - storage Database may store: Individual locations of specimens or sightings Status in an area based on a number of specimens or sightings: (present, absent, introduced, etc.) Locations may be stored as Area names (languages, synonyms, hierarchies, overlaps) Grid coordinates (various systems)
Geographical data - use May be used to generate summary distributions (e.g. for species distribution from specimen data) Maps (point locations or shaded areas) May be used to allow searching by location or area – user may specify a point or an area name
Descriptive data Should be carefully designed, because it is complex and may be used for many purposes It should be Structured Consistently applied It may include data types suitable for statistical and multivariate analysis Special problems exist
Descriptive data Structured, for Querying Classification, phylogenetic analysis Identification Documentation and dissemination
Descriptive data Consistency and comparability: Consistent terminology (c.f. attempts to standardise terms for indexing purposes, as in BioCASE Thesaurus) Same characters for all specimens or taxa Characters precisely defined Discontinuous - set of character states Continuous – units, precision
Descriptive data – special problems Variability specimens within a species repeated structures within a specimen Character dependence (inapplicable characters) Taxonomic hierarchy issues, e.g. Is the data for a species in agreement with the data for a genus? Can the data be stored at the appropriate taxonomic level only?
Images Type Bitmap files, e.g. JPEG Vector graphics, e.g. drawings, diagrams Location In the local database Elsewhere in a separate image bank The Web makes the latter option easy – just store the URL in the database
Biodiversity organisations Database level: ILDIS (International Legume Database and Information Service) - www.ildis.org Data portal level: Species 2000 - www.sp2000.org GBIF (Global Biodiversity Information Facility) - www.gbif.org International agencies: CBD, CITES, WCMC, etc. ... Standards, etc. TDWG (Taxonomic Database Working Group) Lots more
Practical session In the practical session, we will Look at what some of the various biodiversity organisations are doing Try some of their data portals Evaluate some of the biodiversity information systems available (introduced in Part Two of this talk, to follow), from the points of view of scientific and professional users and the general public
Part Two • Biodiversity information systems • (Some of this material appeared in the Computing for Bioinformatics module)
Thoughts • Role of biodiversity data in bioinformatics • assisting with organising and retrieving bioinformatic (molecular) data • a separate area with different users (taxonomy, ecology, conservation, resource management …) • Demand from users for taxonomic and species diversity information on the Web • Pressure on the taxonomic community to deliver • Demand for more sophisticated use of available data: interoperability = online analysis, not just browsing
Assembling biodiversity information sources Delivering species diversity information by assembling, merging & linking databases and publishing on the Web, with special emphasis on linking
Issues in assembling and linking biodiversity information sources Assembling a web-site (ERMS) Assembling databases by merging (ILDIS) Linking on-line databases through a gateway (Species 2000 and SPICE) Onward links to related information Checking the reliability of links (LITCHI) Intelligent linking Persistent identifiers
Assembling species databases First of all, before we start merging and linking databases, let’s assemble a database from scratch: ERMS (European Register of Marine Species) Now at www.marbef.org/data/erms.php
Incoming data Approximately 100 separate lists for different taxonomic groups Mostly compiled as spreadsheets Scientific names, synonyms, geography (at least Atlantic or Mediterranean) Some optional fields Objective to create a book and a web-site, partially supported by a database
List conversion was carried out in several stages: Excel spreadsheets were exported to text files Tab-delimited text files were imported into a client-server database (MySQL) Database queries results are passed through templates to generate either RTF (for the printed publication) or HTML (for the Web site)
Variations on a theme Fields may be combined or separated e.g. genus species authority date Higher taxa may be: repeated in fields of the species record given once in separate preceding records in various different formats Synonyms may be: in a separate field of the species record, or mixed with other remarks, with various delimiters and separators in separate records, linked by code or by name or even abbreviated implied, e.g. Genus1 specname (Smith as Genus2) Geographical information is often free text
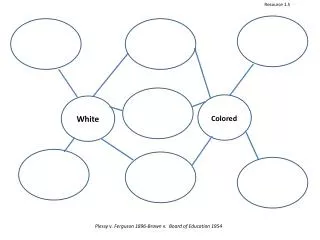
Merging versus linking Merging databases to create a single larger database Linking databases to create a distributed information system
Merging species databases 1 The original databases are physically copied into a new combined database. 2 The user interacts with the new combined database.
Linking 1 The user interacts with an access system which does not itself contain data. 2When the user requests data, it is fetched from the appropriate database.
Assembling databases by merging Now we have some databases, let’s build a bigger one by merging: ILDIS (International Legume Database and Information Service)
ILDIS International Legume Database and Information Service International collaborative project 10 Regional Centres 30 Taxonomic Coordinators Its goals include building, maintaining and enhancing the ILDIS World Database of Legumes designing and providing services from it to users, including: ILDIS LegumeWeb via Species 2000
ILDIS World Database of Legumes v. 7.00 Taxa Species 15,500 Subspecies 1,600 Varieties 2,400 19,500 Names Accepted names 19,500 Synonyms 19,000 39,500
ILDIS’s data model: core data A core taxonomic checklist, assembled from regional data sets and nearing completion, provides a consensus taxonomy - a unified taxonomic treatment or backbone on which other data can be hung Various kinds of additional data may be attached to this backbone (see later)
Features of ILDIS LegumeWeb We’ll look at examples of the use of LegumeWeb, to show a couple of features: Two-stage access with “synonymic indexing” A gateway to external information - “onward links” (direct species name links) to further sources of information
User access to LegumeWeb: Step 1 The user types in a name, which may be incomplete (or wrong!) LegumeWeb responds by showing a list of the species names which fit the user’s specification
User access to LegumeWeb: Step 2 The user chooses one of the species names provided (which may be synonym or an accepted name) In this example, the user chooses Abrus cyaneus (a synonym for Abrus precatorius) LegumeWeb responds by showing a standard set of information about the chosen species
Synonymic indexing Automated synonymic indexing synonym entered accepted name found(name taxon) taxon found synonyms listed Types of synonyms Unambiguous Ambiguous pro parte homonyms misapplied names In these cases an explanation is offered to the user
Assembling databases by linking Now we have some biggish databases, let’s build something even bigger by linking databases together: Species 2000 SPICE Species 2000 Europa
Linking 1 The user interacts with an access system which does not itself contain data. 2When the user requests data, it is fetched from the appropriate database.