Download
1 / 37
531 likes | 1.49k Views
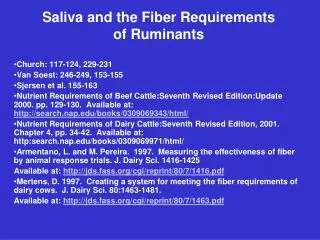
Saliva and the Fiber Requirements of Ruminants. Church: 117-124, 229-231 Van Soest: 246-249, 153-155 Sjersen et al. 155-163 Nutrient Requirements of Beef Cattle:Seventh Revised Edition:Update 2000. pp. 129-130. Available at: http://search.nap.edu/books/0309069343/html/

E N D
Saliva and the Fiber Requirements of Ruminants Church: 117-124, 229-231 Van Soest: 246-249, 153-155 Sjersen et al. 155-163 Nutrient Requirements of Beef Cattle:Seventh Revised Edition:Update 2000. pp. 129-130. Available at: http://search.nap.edu/books/0309069343/html/ Nutrient Requirements of Dairy Cattle:Seventh Revised Edition, 2001. Chapter 4, pp. 34-42. Available at: http:search.nap.edu/books/0309069971/html/ Armentano, L. and M. Pereira. 1997. Measuring the effectiveness of fiber by animal response trials. J. Dairy Sci. 1416-1425 Available at: http://jds.fass.org/cgi/reprint/80/7/1416.pdf Mertens, D. 1997. Creating a system for meeting the fiber requirements of dairy cows. J. Dairy Sci. 80:1463-1481. Available at: http://jds.fass.org/cgi/reprint/80/7/1463.pdf
Functions of saliva in ruminants • Moistens and lubricates feeds • Water balance • Bloat prevention • Intake control • Recycling of nitrogen and minerals to the rumen • Buffering the rumen fermentation • Unlike nonruminants • No enzymes secreted in saliva of mature ruminants
Moistening and lubricating feed Components responsible Water Mucin Functions Protects mucus membrane of mouth and esophagus Aids in bolus formation Water solubilizes soluble components providing access to taste buds Water balance 70% of the fluid entering the rumen Bloat prevention Mucin is a strong anti-foaming agent Intake control (?) Saliva infused into the abomasum increased reticular contractions and DM intake in sheep Infused into the abomasum, ml/hr Saliva:McDougall’s solution 0:1000250:750500:5000:1000 DMI, % BW 1.23 3.5 5.1 1.23 Reticular contractions, 1.4 5.7 % increase over no infusion
Saliva’s role in recycling N and minerals • Nitrogen • In a 24 hour period, a 700 kg cow receiving a mixed hay:grain diet with secrete: • 190 l saliva • 30 to 80 gm total N • 50-130 gm urea • N recycling • Will be important on low protein diets • An important consideration in minimizing N excretion Dietary protein NPN Protein Metabolizable protein Microbial protein NH3 Urea
Amounts recycled General estimates % dietary N recycled = 15-20% CNCPS program % N recycled = (121.7 – 12.02 x %CP + .3235 x %CP2)/100 % CP in diet% N recycled 6 61 8 46 10 34 12 24 14 17 16 12 18 10 Marini et al. (2003) Holstein heifers fed a corn meal-molasses- citrus pulp diet fed at 1.8 x maintenance % CP in diet% N recycled 9.1 30 11.8 37 15.7 25 18.6 22
Routes of N recycling Saliva 15 to 50% of total recycled N Factors Blood urea concentration Saliva flow Gut wall Major route Factors Low ruminal [NH3] Upregulates a urea transporter which increases transfer of urea from blood to epithelium or vice versa Decreases microbial urease activity of microbes adhered to the rumen wall: decreases conversion on urea to NH3 at rumen wall Decreased ruminal pH Converts NH3 to NH4+ in the rumen Only NH3 can cross the rumen wall Marini et al. (2003) % CPN recycled (saliva)N recycled (Gut wall) g/d% of totalg/d% of total 9.1 0.8 3.0 25.1 97.0 11.8 1.5 3.6 39.6 96.4 15.7 3.8 10.4 32.7 89.6 18.6 5.4 13.7 33.9 86.3
Urea Diffusion into RumenUpdate Rumen wall Urea transporter Blood urea Urea High [NH3] inhibits NH3 Bacterial population Urease
Minerals 700 kg cow producing 190 l saliva/day will secrete: 1100 gm NaHCO3 350 gm Na2 HPO4 100 gm NaCl Minerals recycled in saliva Na P S
Classes of salivary glands • Serous glands • Include: • Parotid glands • Inferior molar glands • Properties • Saliva is quite fluid • Parotid glands secrete ½ of all saliva • Saliva is isotonic with plasma • Saves osmotic work • Saliva is strongly buffered with HCO3- and HPO4-2 • Secrete continuously, but increased with eating and ruminating
Mucus glands Include: Palatine glands Buccal glands Pharyngeal glands Properties Vary mucus saliva Isotonic with plasma Saliva is strongly buffered with HCO3- and HPO4-2 Low flow when not stimulated Mixed glands Include Submaxillary Sublingual Labial Properties Very mucus saliva Hypotonic to plasma Poorly buffered Variable flow
Composition of saliva • Composition from different glands HCO3-HPO4-2Cl-Na+K+ Parotid 95 75 13 186 5 Inferior molar 134 48 10 175 9 Palatine and Buccal 109 25 25 179 4 Submaxillary 6 54 6 15 26 • Composition control • Adrenal cortex • Aldosterone • Kidney • Renin • Factors affecting saliva composition • Sodium deprivation • As concentration of Na decreases, the concentration of K increases to maintain concentration of total cations • Rate of saliva secretion • As rate of secretion increases • [Na+] and [HCO3-] increases • [K+] and [HPO4-2] decreases
Saliva secretion • Control of secretion • Controlled by the vagus nerve through receptors in the mouth, esophagus, reticulum, reticuloruminal fold, and reticulo-omasal orifice • Stimuli • Stretch up to 20 mm Hg • Rumination
Factors affecting saliva flow Activity of animal Activity% of saliva flow Resting 36 Eating 27 Ruminating 37 Feed consumption Increased DM intake increases saliva flow Type and physical form of diet Factors that limit rumination will limit saliva flow Saliva secretion will be decreased as: Grain level in the diet increases Maturity of forage in the diet decreases The particle size of the feedstuffs decreases The diet moisture level increases DietSaliva secretion (gm/gm feed consumed) Dairy cubes .68 Fresh grass .94 Silage 1.13 Dried grass 3.25 Hay 3.65
Saliva’s role in buffering the rumen • Significance of the rumen buffering system • Enough organic acids are produced in the rumen to cause the pH to drop to 2.8 to 3.0 without buffering • Normal rumen pH range is 5.5 to 7.1 • Components of the rumen buffering system __pK__Buffering range HPO4-2 (second H+) 7.1 6-7 HCO3- (first H+; saliva and 6.4 5.5-7 rumen wall) Acetate 4.8 Propionate 4.9 Butyrate 4.8 Lactate 3.9 5-6 Glutamate 5.6 Aspartate 5.2 Alfalfa protein isoelectric point 5.5 NH3 9.3 Cation exchange capacity VFA absorption
Role of cation exchange in buffering the rumen • Cation exchange capacity • The concentration of charged groups like proteins, lignins, and pectins that exchange cations like Ca+2, Mg+2, and K+ for H+ • Cation exchange capacity of different forages CEC, mEq/100 gm ForageMechanical pulpNDF Fescue 59 111 Timothy 68 132 Orchardgrass 72 120 Rice straw 43 57 Alfalfa 152 104 Red clover 169 139 White clover 294 249
Buffering range in the rumen • The rumen is well-buffered for acid, but poorly for alkali • Buffer curve 9 8 7 6 5 4 pH 40 20 0 20 40 60 80 100 120 1N KOH added 1N HCl added
Ruminant fiber requirementEffects of fiber on ruminant intake, digestion and metabolism • Digestibility • Inadequate fiber • Results in reduced fiber digestion • Cause • Maximum growth of cellulolytic bacteria and protozoa occurs between pH 6 and 7 • If the effective fiber concentration of the diet is > 24.5%, rumen pH will decrease resulting in reduced fiber digestion Effective fiber is the NDF remaining on a 1.18 screen, as a % of total DM eNDFpH% of maximum fiber digestion 24 6.4 98 20 6.3 95 16 6.1 87 12 5.9 70 8 5.7 28 4 5.6 0
Physiological cause for the inhibition of cellulolytic bacteria ATP energy production from the proton motive force across the cell membrane is inhibited by acids entering the cells Inadequate quantities of HCO3- which is the active form of CO2 for anerobic bacteria Toxicity of the VFAs and lactate greater because nonionized forms more readily cross cell membranes Reduced ruminal turnover reduces efficiency of microbial growth Excess fiber If lignified, high levels of fiber may reduce DM digestibility because soluble constituents are diluted
Fermentation endproducts Volatile fatty acids Decreased fiber causes reduced pH which causes Increased production of total VFAs Decreased molar proportions of acetate and butyrate Increased molar proportions of propionate 80 40 Acetate Propionate Molar % Lactate 7 6 5 pH
Cause of changes in VFAs Primary end-products of cellulolytic bacteria (pHopt6-7) Acetic acid Butyric acid Carbon dioxide Hydrogen Primary end-products of amylolytic bacteria (pHopt5-6) Acetic acid Propionic acid Lactic acid Hay:Concentrate 60:4040:6020:80 VFAs, molar % Acetic acid 66.9 62.9 56.7 Propionic acid 21.1 24.9 30.9 Butyric acid 12.2 12.2 12.4
Effects of changes in VFA concentrations on efficiency of energy use for body tissue or milk synthesis Decreasing the concentration of acetate and increasing the concentration of propionate will decrease the energetic efficiency of milk production while increasing that of body tissue synthesis Hay:grain ratio Item60:4040:6020:80 ME intake, Mcal 36.12 36.42 34.87 Energy balance, Mcal, RE 11.94 12.63 12.16 Milk energy, Mcal, LE 13.94 13.17 10.41 LE/RE x 100 117 104 86 Tissue energy, Mcal -2.00 -.54 1.75 Milk fat, % 3.5 3.0 2.7 Acetate/Propionate 3.32 2.57 2.00 70 40 10 Milk Milk or body weight Synthesis, kcal / 100 Kcal ME above maintenance Body tissue 30 40 50 60 70 Acetic acid, % of total VFA
Cause for difference in energy partitioning Old theory Decreasing [Acetate] and increasing [Propionate] reduces milk fat synthesis and increases body tissue synthesis Basis: Propionate is needed to synthesize glucose Glucose needed for acetate metabolism for energy and fat synthesis Glucose stimulates insulin secretion Insulin increases glucose uptake by adipose and muscle tissue, but not mammary tissue Results in acetate being preferentially used by adipose and muscle tissue Current theory Reduced pH increases production of trans-10, cis-12 conjugated linoleic acid from polyunsaturated fatty acids Trans-10, cis-12 conjugated linoleic acid inhibits long chain fatty acid synthesis in the mammary gland
Microbial yield Inadequate dietary fiber Decreased salivary buffers Decreased pH Decreased osmotic pressure Decreased liquid turnover Decreased efficiency of microbial growth eNDFTheoretical maximum microbial synthesis, g/g CHO fermented 24 .4 20 .4 16 .36 12 .32 8 .28 4 .24
Feed consumption At high fiber levels, feed intake is limited by the physical volume occupied by fiber Physical limitation is freed by: Digestion Particle size reduction Passage 40 kg milk 20 kg milk 4 3 2 DMI, % BW Physical limitation Physiological control 20 30 40 50 NDF, % DM
At low fiber levels, feed intake is under physiological control Limitations VFAs Increased [Acetate] in the rumen decreases feed intake Increased [Propionate] in the portal vein decreases feed intake Hormones Insulin Glucagon Osmolality Increased [H+] in duodenum reduces reticuloruminal contractions to reduce feed intake Acidosis a problem in feedlot cattle and dairy cows rapidly changed from a high forage to a high grain diet Fiber’s role on low fiber diets Saliva flow Provides buffers Prevents undesirable microorganisms Dilutes VFAs Increases liquid turnover Motility
Long-term health problems Parakeratosis Liver abscess Laminitis Inadequate fiber Decreased pH Increased VFA and lactic acid Decreased gram- bacteria Release histamine and endotoxins (?) Increased blood pressure Dilation and damage to blood vessels
Displaced abomasum Decreased fiber Muscle atrophy Subclinical acidosis Decreased feed intake Empty abomasum Displaced abomasum
The fiber requirements of ruminant animals • Previous requirements • Dairy • Before 1989 • Minimum of 17% CF • 1989 NRC • Minimum of 21% ADF for first 3 weeks • Minimum of 19% ADF at peak lactation • Beef • Before 1996 NRC • Minimum of 10% roughage
Limitations of previous requirements CF and ADF do not represent all fiber fractions CF contains variable amounts of cellulose and lignin ADF contains cellulose and lignin NDF contains cellulose, lignin, hemicellulose and pectins While related to digestibility, CF and ADF are not as highly related to the rate of digestion as NDF NDFADFCF r TDN .65 .76 .80 Rate of digestion is important at high feed intakes NDF is more highly related to feed volume than CF or ADF NDFADFCF r Feed volume .78 .62 .71 NDF is more highly related to chewing time than CF or ADF NDFADFCF r Chewing time .86 .73 .76
Using a static fiber percentage prevents the opportunity to meet the fiber requirement and come close to meeting the energy requirements of high producing dairy cows Feed intake, lb/day Milk production, lb/day Body weight, lb 0 10 20 30 40 Week of lactation
Fiber requirements have not considered the physical form of the fiber Physical form affects chewing time Particularly a problem with high fiber byproduct feeds To consider physical form, the Beef NRC used effective NDF (eNDF) to express the fiber requirement of beef cattle Definition - % NDF remaining on a 1.18 mm screen after dry sieving eNDF Feed% NDF% of NDF% of DM Corn cobs 87 56 49 Cracked corn 10.8 60 6.7 Whole corn 9.0 100 9.0 Corn gluten feed 36.0 36 12.8 Corn silage 41.0 71 29 Alfalfa haylage (1/4” cut) 43.0 67 29 Alfalfa hay, late vegetative 37.0 92 34 Oat straw 63.0 98 62 Bromegrass hay, pre-bloom 55.0 98 54 Relationship to rumen pH Rumen pH = 5.425 + .04229 x eNDF for eNDF < 35% DM Doesn’t consider cation exchange capacity
Current fiber requirements Beef cattle Minimum eNDF, % DM High concentrate diets to maximize 5 – 8 Gain/Feed, good bunk management & ionophore Mixed diet, variable bunk management or 20 no ionophore High concentrate diet to maximize 20 non-fiber carbohydrate (NFC) use & microbial yield
Lactating dairy cows Assumptions Total mixed ration fed Adequate particle size of the forage Grain is corn Recommendations (Adjusted for minimum forage NDF in diet DM) ForageDiet Minimum NDF, %DMMinimum NDF, %DMMaximum NFC, % DM 19 25 44 18 27 42 17 29 40 16 31 38 15 33 36 Adjustments Starch source High moisture corn 27% NDF (Minimum) Barley 27% NDF (Minimum) Forage particle size Desire length of chop of forage at ¼” 15 to 20% of particles > 1.5” If mean particle size of forage decreases below 3 mm, then the minimum dietary NDF % should be increased several percent Dietary buffers Can lower NDF requirements Method of feeding Feeding separate components will increase the NDF requirement
Additional recommendations for dairy cattle % of diet DM Nonstructural carbohydrates 30-40 Non-fiber carbohydrates 32-42 Merten’s approach to meeting the fiber requirements of dairy cattle Daily requirement for NDF in optimum ration is 1.2% of BW Assumptions Forage supply 70 to 80% of the NDF Forages are chopped at no less than ¼” Allows the percentage of fiber in the diet to vary with milk production and feed intake Recommended minimums % NDF First 3 weeks 28 Peak lactation 25
Use of buffers in ruminant diets • Functions of buffers • Increase ruminal pH • Maintain DM intake • Prevent acidosis • Increase liquid turnover • Buffers commonly used BufferAdditional effectsPreventative level Sodium bicarbonate - 1.2 to 1.6% of grain .75% of diet Sodium sesquicarbonate - .3 to .75 lb/d Magnesium oxide Increase uptake .4 to .5% of grain of acetate by mammary gland .1 to .2 lb/d Potassium carbonate Provides potassium .5 to .9 lb/d
Buffers are most effective when: Early lactation Switching from high forage to high grain diets Diet is deficient in effective fiber Concentrates and forages are fed separately Fermented forages are the only forage source Particularly a problem with corn silage Large amounts of fermentable carbohydrates are fed at infrequent intervals Small particle size or high moisture level of the grain Milk fat percentage of dairy cows is low Milk fat % is .4 units < Protein % Milk fat % is < 2.5% in Holsteins Off-feed problems caused by feeding rapidly fermenting feeds Heat stress Limitations of buffers Unpalatable 2% sodium bicarbonate or 1% Magnesium oxide will reduce feed intake Responses are short-lived Buffers don’t cure all problems associated with low fiber diets Displaced abomasum Health problems associated with buffers: Bloat Urinary calculi Diarrhea