Download
1 / 21
210 likes | 360 Views
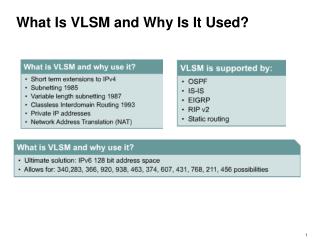
Sounding Analysis and Research Tools: What is used at Rapid City?. Matthew J. Bunkers NOAA/NWS, Rapid City, SD. Motivation. Do you like this graph?. Or this one?. Motivation. Do you want to make charts like this?. http://www.crh.noaa.gov/unr/?n=pw. Outline. Plot and analyze a hodograph

E N D
Sounding Analysis and Research Tools: What is used at Rapid City? Matthew J. Bunkers NOAA/NWS, Rapid City, SD 12th Annual Northern Plains Workshop, Bismarck, ND, 8-9 April 2008
Motivation Do you like this graph? Or this one?
Motivation Do you want to make charts like this? http://www.crh.noaa.gov/unr/?n=pw
Outline • Plot and analyze a hodograph • Create a precipitable water chart • Tell you where to get the tools
Hodograph • Get data – http://raob.fsl.noaa.gov; or radiosonde database on CD-ROMs • Run C program – hodo.c • Need UNIX/Linux • Plot in spreadsheet – Excel graph • Customize, analyze, print, save image
Hodograph – Get data 6/6/04: 70-110 nm NW of BIS Ord: 240 @ 30 kts RM: 269 @ 26 kts LM: 217 @ 47 kts
Hodograph – Get data http://raob.fsl.noaa.gov/ Plus Radiosonde Database of North America CD-ROMs (1948mid 1990s)
Hodograph – Excel spreadsheet Ord: 240 @ 30 kts RM: 269 @ 26 kts LM: 217 @ 47 kts
Precipitable water • Get data – http://raob.fsl.noaa.gov; or radiosonde database on CD-ROMs • Run C program – pw.c • Plot in spreadsheet – Excel graph • Customize, analyze, print, save image
Precipitable water – Get data http://raob.fsl.noaa.gov/ Plus Radiosonde Database of North America CD-ROMs (1948mid 1990s)
Precipitable water – Get data May have to concatenate several files; put 999 at end
Precipitable water – pw.c • Compile this program just like hodo.c • See comments within program
Where do I get this? • http://www.crh.noaa.gov/unr/?n=scm • convectM.c • Computes multiple sounding variables
Wrap-up • These programs provide opportunity for nice graphics and climatological studies • Garbage input soundings = garbage output variables • I don’t provide “official” support • New variables don’t get added quickly