Download
1 / 15
150 likes | 263 Views
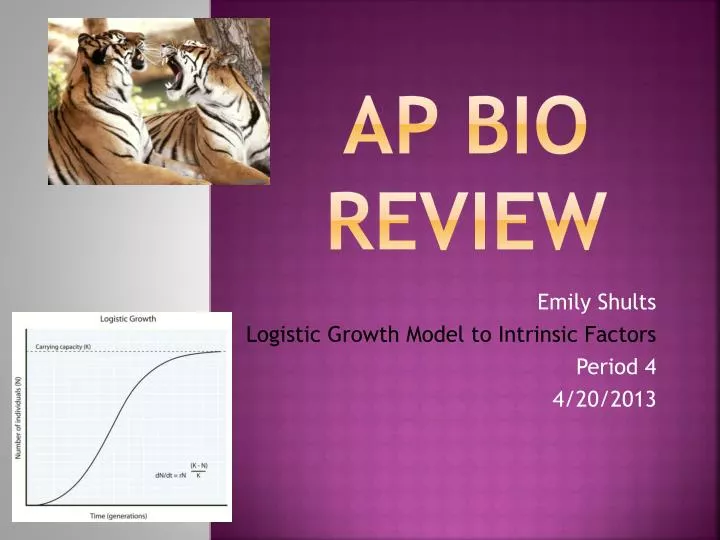
AP Bio Review. Emily Shults Logistic Growth Model to Intrinsic Factors Period 4 4/20/2013. Logistic Growth Model-Introduction. As population resources for each individual Carrying Capacity (k): max population size an environment can support

E N D
AP Bio Review Emily Shults Logistic Growth Model to Intrinsic Factors Period 4 4/20/2013
LogisticGrowthModel-Introduction • As populationresourcesforeach individual • CarryingCapacity(k): maxpopulationsizeanenvironment can support • Variesbylimitingresorucessuch as energy, shelter, refugefrompredators, soilnutrients, water • Crowding and resourcelimitationseffectpopulationgrowth (slowsreproductionrate) • The per capitadeathrate (m) willincreaseifnotenoughenergyisconsumed
Formula m= per capitadeathrate r= per capitaincrease K= maximumcarryingcapacity N=populationsize (K-N)= number of individualscarryingcapacity can support **LogisticPopulationGrowthModel: Per capitarate of increase declines as carryingcapacityisreached**
Explanation… • (K-N) = number of individualsenvironment can sustain • (K-N)/K isthefraction of K (caryingcapacitythatisstillavailable • Bymultiplyingtheexponentialrate of increase (rmaxN) by (K-N)/K we are modifyingthegrowthrate as N increases
Continued… • When N issmallcomparedto K (populationcomparedtocarryingcapacity) theterm (K-N)/K isclosetotheinstrisic (maximum) rate of increase. • When N islarge and resources are limiting, (K-N)/K issmall and so isthe per capitarate of increase. • When N=K rateis 0 and thepopulationstopsgrowing
LogisticGrowthModel • Produces a sigmoid (S) shape • New individuals are addedtopopulationmostrapidly at intermediatepopulationsizes (substantialbreedingsize and resources) • Populationdramaticallyslows as N approaches K • TO DECREASE IN RATE BIRTH RATE MUST DEACREASE OR DEATH RATE MUST INCREASE
LogisticModel • Assumesthatpopulationsadjustinstantlytogrowth and apprachcarryingcapacitysmoothly…NOT TRUE(butthereis a lag time) • Real WorldExample: Ifpopulation of Daphniadropsbelow K, thereis a delay of populationgrowthuntilincreasing # of offspring are born • Alsoassumesthateach individual addedto a populationhas thesamenegativeeffectonpopulationgrowth--notalwaysthe case *AlleleEffect* (someorganismssurvive and reproduce better at highpopulationdensity • Helpedtopredictpossiblepopulationfluctuations
Natural Selection • HighPopulationDensity- Not a lot of resources, slowgrowth, and selectionfavorsindividualsthat can reproduce withfewresources • LowPopulationDensity- Favorstraitssuch as production of numerous, smalloffspring HIGH LOW
K and R Selection • Selectionforlifehistorytraitsthat are sensitivetopopulationdensityisK-Selectionordensitydependent. Theymaximizepopulationsize and operate in populations living at densitiesnearthelimitimposedbyresources. • Selectionfortraitsthatmaximizereproductivesuccess in uncrowded places isR-Selectionordensityindependent. Theytendtomaximize R andensityfluctuateswaybelowcarryingcapacity.
PopulationChange and PopulationDensity • Birth/Deathratethatdoesn’tchangewithpopulationdensityisdensitydependent • Birth/Deathratethatdoeschangewithpopulationdensityisdensityindependent • A populationmight stop growing and reachequillibriumduetocombinations of bothfactors
Thisgraph shows a densitydependentbirthrate and anindependentdeathrate Thisgraph shows a densityindependentbirthrate and a densitydependentdeathrate Thisgraph shows a densitydependentbirth and deathrate
FactorsthatAffectPopulationGrowth • CompetitionforResources: as a birdpopulationdensityincreasesbyavailableresources, a femalelaysfewereggs(density-dependent response) • Territoriality: Cheetahs are highly territorial and use chemicalcommunicationstowarnothercheetahs of theirboundaries (lesshabitat and shelter) • Health: influencedbyhealth and survival of organisms-disease. Humanpathogens can show densityindependentinfectionratessuch as TB whichismostlikelyto spread in dense areas.
More Factors • Predation: important cause of density-dependentmortalityforsomepreybecause a predatorencounters and captures more food as populationdensityincreases. • ToxicWaste: Affectdensitydependentregulation of populationsizemetabolicby-products in thelabaccumulate as popualtiongrows and poisonstheorganisms in the artificial environment.
IntrisicFactors • Intrisic (physiological)factorsratherthanenvirnomentalfactors can affectreproduction of organisms • Aggressivebehaviorincreaseswithpopulationdensity • Highpopulationdensities can cause stress, increase in mortality and decrease in deathratesdueto hormones releasedthatdelay sexual maturation Stressedbunny
THE END Bio’sfun.