Download
1 / 18
180 likes | 315 Views
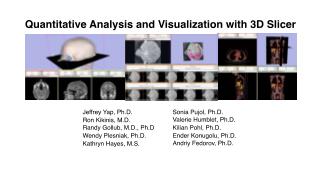
PET/CT Visualization and Analysis. PET /CT Analysis using 3D Slicer. Jeffrey Yap PhD Ron Kikinis MD Wendy Plesniak PhD. CTSA at RSNA 2010. --. PET/CT Visualization and Analysis: Start fresh. First, close any previous scene. Select File->Close Scene.

E N D
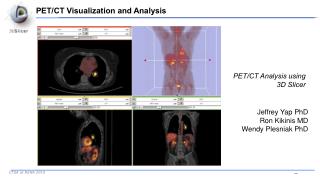
PET/CT Visualization and Analysis PET/CT Analysis using 3D Slicer Jeffrey Yap PhD Ron Kikinis MD Wendy Plesniak PhD CTSA at RSNA 2010 --
PET/CT Visualization and Analysis: Start fresh. First, close any previous scene. Select File->Close Scene This removes any datasets previously loaded into Slicer. CTSA at RSNA 2010 --
PET/CT Visualization and Analysis: Load the new scene Select File->Load Scene This raises the Load Scene Interface select the file called PETCTFusion-Tutorial-Scene.mrml Double click the file, or click Open CTSA at RSNA 2010 --
PET/CT Visualization and Analysis: About the data Non small cell lung cancer patient Two PET studies: baseline acquired before treatement, and followup acquired 1 month after chemotherapy Two non-diagnostic CT images are acquired without the use of contrast FDG-PET scans acquired 60 minutes after intravenous injection of approximately 20 mCi of 18FDG Two VOIs have been created using Slicer’s Editor Module. CTSA at RSNA 2010 --
PET/CT Visualization and Analysis: Select baseline study Note: Module requires DICOM format data In the Data Fusion panel, select: CT volume: CT1 PET volume: PET1 Tumor Mask: PET1-label When the PET volume is selected, a “wait message” will be displayed while parameters are read from DICOM header. CTSA at RSNA 2010 --
PET/CT Visualization and Analysis: Information displayed in “Layers” Note: this stacks the PET, CT and VOI in three layers: Background = CT1 Foreground = PET1 Overlay (Label) = PET1-label where they can be blended into a single visualization CTSA at RSNA 2010 --
PET/CT Visualization and Analysis: Adjust display of the baseline study In the Display Panel, choose a colorization option for the PET volume from among Grey, Heat, or Spectrum. Adjust the window and level for CT1 and PET1 volumes. Adjust the Slices Fade Scale to jointly display the datasets in the foreground and background layers. CTSA at RSNA 2010 --
PET/CT Visualization and Analysis: Explore the visualization Explore: in the Slice Viewers, scroll through the slices to locate the green Tumor label and the yellow Liver label. Note: (the yellow label is used only to demonstrate multiple-VOI functionality). CTSA at RSNA 2010 --
PET/CT Visualization and Analysis: View tumor in all slice viewers Shortcut: To view the Tumor Label in all Slice Viewers: Enter –740 in the Axial Slice Viewer’s Slice Number Entry …and… -54 (Sagittal) 103 (Coronal). These are (mm) positions within the reference frame of the image volumes. CTSA at RSNA 2010 --
PET/CT Visualization and Analysis: Compute SUV for all VOIs in baseline In the Quantitative Measures panel, click the Compute/Refresh button. SUVmax and SUVmean for each VOI (represented by a different color in the label map) will be displayed in the table. CTSA at RSNA 2010 --
PET/CT Visualization and Analysis: Compute SUVbw for follow-up study Look for response to treatment in the follow-up study: In the Data Fusion panel, set: CT volume = CT2, PET volume = PET2 and Tumor Mask = PET2-label. This dataset contains two VOIs that correspond to the segmentations the baseline study. CTSA at RSNA 2010 --
PET/CT Visualization and Analysis: Modify display of the follow-up Adjust the display for the follow-up study. You may want to adjust the Slices Fade Slider and manipulate the 3D View to refresh them. CTSA at RSNA 2010 --
PET/CT Visualization and Analysis: Compute SUVbw for follow-up In the “Quantitative Measures” Panel: select Compute/Refresh to compute SUVbw for the green Tumor volume (and yellow liver volume). CTSA at RSNA 2010 --
PET/CT Visualization and Analysis: Assess response wrt this VOI Pre-Treatment Max SUVbw = Post-Treatment Max SUVbw = 8.0 9.4 +16.61% (SD) CTSA at RSNA 2010 --
PET/CT Visualization and Analysis: Appropriate Use Still validating this module against performance of commercial systems. Appropriate only for DICOM PET studies only Not compatible with Philips datasets CTSA at RSNA 2010 --
Workshop Summary • This workshop has demonstrated: • Basic scene loading and visualization using 3D Slicer • Use of Slicer’s ChangeTracker module to assess small changes in tumor size • Workflow to make quantitative measurements of SUV (body weight) in Slicer’s PETCTFusion module CTSA at RSNA 2010 --
Workshop Summary: Slides and Datasets Tutorial Slides: http://wiki.na-mic.org/Wiki/images/PETCTTutorial.pptx Tutorial Data: http://wiki.na-mic.org/Wiki/images/7/73/PETCTFusion-Tutorial-Data.zip Tutorial Software: www.slicer.org/Downloads More Information: http://www.slicer.org CTSA at RSNA 2010 --
Acknowledgements Harvard Clinical and Translational Science Center National Alliance for Medical Image ComputingNIH U54EB005149 Brain Science Foundation INRIA, France Neuroimage Analysis Center (NAC) National Center for Image-Guided Therapy (NCIGT) Surgical Planning Laboratory, Brigham and Women’s Hospital CTSA at RSNA 2010 --