
NMR Spectroscopy: Understanding & Applications
E N D
Presentation Transcript
NMR spectroscopy Presented by Jaghdish Battu Dept.of Chemistry Avanthi Degree & P.G College
Objectives • Student should gain better understanding of NMR spectroscopy. • Student should gain experience in the acquisition, processing, and displaying NMR data. • Student should gain experience in interpreting NMR data in order to establish structure for unknown organic molecules. • Student should gain understanding in advanced 1Dimensional and 2Dimensional NMR techniques.
Introduction • The Nobel Prize has been awarded twice for work related to NMR. F. Bloch and E.M. Purcell received the Nobel Prize in Physics, in 1952, for the first experimental verifications of the phenomenon, and Prof. R.R. Ernst received the Nobel Prize in Chemistry, in 1991, for the development of the NMR techniques. • Since its discovery 50 years ago, in 1945, it has spread from physics to chemistry, biosciences, material research and medical diagnosis.
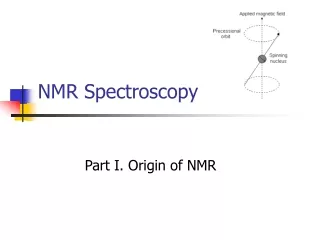
The Physical Basis of the NMR Experiment • Imagine a charge travelling circularily about an axis builds up a magnetic moment • It rotates (spins) about its own axis (the blue arrow) and precesses about the axis of the magnetic field B (the red arrow). The frequency of the precession () is proportional to the strength of the magnetic field: • = B0 • = magnetogyro ratio Magnetic field mrasured in Tesla 1 T = 10,000 gauss
Magnetogyric ratio() The larger the value of the magnetogyric ratio, the larger the Magnetic moment (m) of the nucleus and the easier it is to see by NMR spectroscopy. Energy difference (DE) between Iz = +1/2 and Iz = -1/2.
The Physical Basis of the NMR Experiment: • Nuclear magnetic resonance, or NMR as it is abbreviated by scientists, is a phenomenon which occurs when the nuclei of certain atoms are immersed in a static strong magnetic field and exposed to a second oscillating magnetic field in the form of radiofrequency pulses, it is possible to transfer energy into the spin system and change the state of the system. After the pulse, the system relaxes back to its state of equilibrium, sending a weak signal that can be recorded.
Larmour frequency • Precession: The circular movement of the magnetic moment in the presence of the applied field. • Larmour frequency : The angular frequency of the precessionis related to the external magnetic field strength B0, by the gyromagnetic ratiog : w0 = gB0
Spin quantum number(I) • Nuclear spin is characterized by a spin number, I, which can be zero or some positive integer multiple of 1/2 (e.g. 1/2, 1, 3/2, 2 etc.). Nuclei whose spin number, I= 0 have no magnetic moment(m);eg. 12C and 16O show no NMR signal. Elements such as 1H, 13C, 19F and 31P have I=1/2, while others have even higher spin numbers: • I=1 14N, 2H • I=3/2 11B, 35Cl, 37Cl, 79Br, 81Br. • As the values for I increase, energy levels and shapes of the magnetic fields become progressively more and more complex.
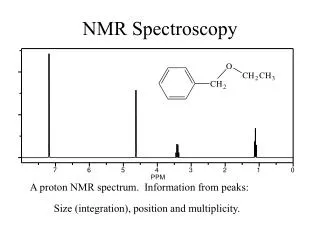
g-rays x-rays UV VIS IR m-wave radio 10-10 10-8 10-6 10-4 10-2 100 102 wavelength (cm) Information in a NMR Spectra 1) Energy E = hu h is Planck constant u is NMR resonance frequency ObservableNameQuantitativeInformation Peak position Chemical shifts (d) d(ppm) = uobs –uref/uref (Hz)chemical (electronic) environment of nucleus Peak Splitting Coupling Constant (J) Hz peak separation neighboring nuclei (intensity ratios) (torsion angles) Peak Intensity Integral unitless (ratio) nuclear count (ratio) relative height of integral curve T1 dependent Peak Shape Line width Du = 1/pT2 molecular motion peak half-height chemical exchange uncertainty principal uncertainty in energy
How NMR is achieved • Liq N2 Liq He Magnet
Nuclear Magnetic Resonance • Sample Preparation NMR samples are prepared and run in 5 mm glass NMR tubes. Always fill your NMR tubes to the same height with lock solvent Deuteron resonance serves as lock- signal for the stabilisation of the spectrometer magnetic fieled.
Common NMR solvents • Acetone- d6 Ethanole- d6 Acetonitrile- d3 • Formic acid- d2 Benzene- d6 Methanole- d4 • Chloroform- d1 Nitromethane- d3 Deuteriumoxide-D2O • Pyridine- d5 Dichloromethane- d2 1,1,2,2- Tetrachloroethane- d2 Dimethylformamide- d7 Tetrahydrofurane- d8 Dimethylsulfoxide- d6 • Toluene- d8 1,4- Dioxane- d8 Trifluoroacetic acid- d1 • NMR solvents are used as reference peaks • to adjust the ppm values in the spectrum • relative to TMS (tetramethyl silane)
The Proton NMR • Stereochemical Equivalent/Non-equivalent Protons • Chemical Shift • Spin Coupling • NMR Splitting of Signals • Coupling Constant( J )
Chemical Shift • The chemical shift of a nucleus is the difference between the resonance frequency of the nucleus and a standard, relative to the • standard. This quantity is reported in ppm and given the symbol delta, d. • d = (n - nREF) x106 / nREF
The NMR scale (d, ppm) Chemical shift (d) is a relative scale so it is independent of Bo. Same chemical shift at 100 MHz vs. 900 MHz magnet IMPORTANT: absolute frequency is field dependent (n = g Bo/ 2p) At higher magnetic fields an NMR spectra will exhibit the same chemical shifts but with higher resolution because of the higher frequency range.
Chemical Shift Trends • For protons, ~ 15 ppm: Alcohols, protons a to ketones Aromatics Amides Acids Aldehydes Olefins Aliphatic ppm 15 10 7 5 2 0 TMS
Chemical Shift Trends • For carbon, ~ 220 ppm: Aromatics, conjugated alkenes C=O in ketones Aliphatic CH3, CH2, CH Olefins ppm 210 150 100 80 50 0 TMS C=O of Acids, aldehydes, esters Carbons adjacent to alcohols, ketones
Spin-Spin Coupling • Nuclei which are close to one another exert an influence on each other's effective magnetic field. This effect shows up in the NMR spectrum when the nuclei are nonequivalent. If the distance between non-equivalent nuclei is less than or equal to three bond lengths, this effect is observable. This effect is called spin-spin coupling or J coupling.
Spin-Spin Coupling • For the next example, consider a molecule with spin 1/2 nuclei, one type A and type B • This series is called Pascal's triangle and can be calculated from the coefficients of the expansion of the equation (x+1)n
1 H 1 3 C 1 1 H H Coupling Constants Energy level of a nuclei are affected by covalently-bonded neighbors spin-states three-bond one-bond Spin-States of covalently-bonded nuclei want to be aligned. +J/4 J (Hz) bb I S ab ba -J/4 S I I S aa +J/4 The magnitude of the separation is called coupling constant (J) and has units of Hz.
Coupling Constants IMPORTANT: Coupling constant pattern allow for the identification of bonded nuclei. Multiplets consist of 2nI + 1 lines I is the nuclear spin quantum number (usually 1/2) and n is the number of neighboring spins. The ratios between the signal intensities within multiplets are governed by the numbers of Pascals triangle.