Download
1 / 25
250 likes | 272 Views
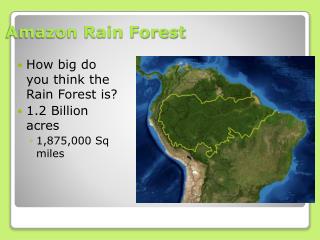
Explore the intricate network of nutrient availability in Amazon rainforests through soil analysis, biomass inventories, and nutrient concentrations. Understand the fragile balance between forest health and soil quality.

E N D
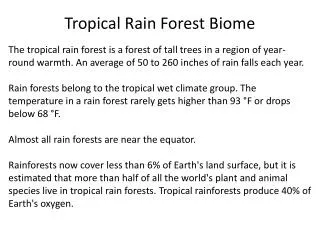
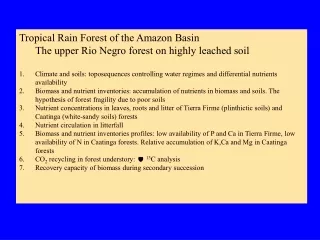
Tropical Rain Forest of the Amazon Basin • The upper Rio Negro forest on highly leached soil • Climate and soils: toposequences controlling water regimes and differential nutrients availability • Biomass and nutrient inventories: accumulation of nutrients in biomass and soils. The hypothesis of forest fragility due to poor soils • Nutrient concentrations in leaves, roots and litter of Tierra Firme (plinthictic soils) and Caatinga (white-sandy soils) forests • Nutrient circulation in litterfall • Biomass and nutrient inventories profiles: low availability of P and Ca in Tierra Firme, low availability of N in Caatinga forests. Relative accumulation of K,Ca and Mg in Caatinga forests • CO2 recycling in forest understory: d13C analysis • Recovery capacity of biomass during secondary succession
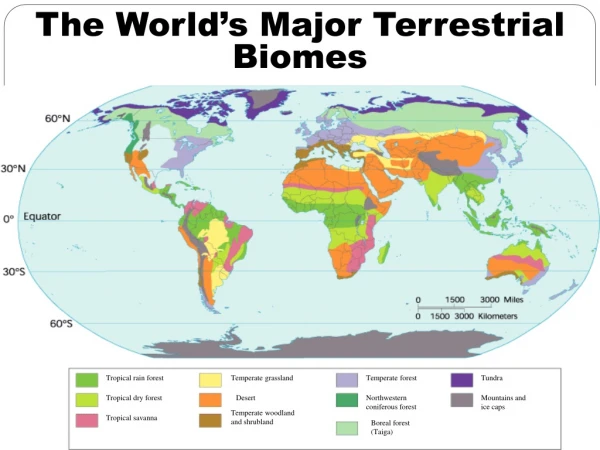
South America Vegetation Map (Hueck 1966) 1-14. Forests of the Orinoco and Amazon basins 15-17. Forests of the east Andean slopes 18. Rainforests of the Pacific and Caribbean 19. Venezuelan “Tradewind” forests 20. Brasilian coastal forest 21. East and south brasilian forests 22. Araucaria forests of south Brasil Forest poor regions (in yellow) 3. Savannas in the Guayana plateau 4. Orinoco Llanos 5. Pantanal of Mato Grosso 23-24. Chaco region 25. Savanna landscape in Sta. Cruz 27-28. Campos Cerrados Very dry tropical forests (in brown) 29-30. Northeastern Brazilian Caatinga 32. Caribbean dry forests of Venezuela and Colombia
Degree of leaf inclination in representative shrubs of the Low Caatinga (Bana) vegetation in San Carlos de Río Negro 1. Rodognaphalopsis discolor 2. Clusia sp. 3. Macairea rufescens 4. Remijia morilloi
Differences in leaf surface temperatures at noon time as affected by degree of leaf inclination and transpiration (Anthurium sp.)
Forest sequence at San Carlos de Río Negro Northern Amazon basin, Venezuela Characteristic species Aspidosperma album Calycophyllum obovatum Catostemma spp. Pachyra spp. Moriri uncitheca Remijia involucrata Licania heteromorpha Caryocar glabrum Aspidosperma megalocarpum Protium sp Vochysia sp. Eperua leucantha Glycoxylon inophyllum Micrandra sprucei Manilkara sp. Monopteryx uaucu Eperua purpurea Micrandra spruceana
Percent frequency of soil water tension(mbar) measured daily along a topographical gradient from mixed forest on oxisol TF, through Yévaro(Eperua purpurea Ep) and Guaco (Monopterix uacu Mu) forests, Tall Caatinga(TC) and Low Caatinga(LC). Values are weighed frequencies of soil tension measured daily at 20, 45 and 75 cm depth between November 23, 1981 and September 22, 1982 (data from Franco and Dezzeo 1994) T.F. E.p. M.u. T.C. L.C.
Biomass and leaf area indices for rainforests of the upper Río Negro basin. Values in t ha-1 Forest type Leaf biomass LAI Aboveground Belowground Total Biomass Root/shoot Mixed Forest on oxisol (1) 8.6 261 48.5 310 0.2 (2) 9.8 7.5 234 57 292 0.2 (3) 61 Yévaro forest on ultisols (4) 273 70* 343 Guaco forest on ultisols (5) 423 42 465 0.1 Tall Amazon Caatinga on tropaquods (4) 266 134 * 400 (6) 6.9 4.5 237 119 356 0.5 (3) 61 Low Amazon Caatinga on tropaquod (7) Tall Bana 9.7 4.8 182 128 310 0.7 Low Bana 4.3 3.3 40 69 109 1.7 Open Bana 1.1 1.4 6 42 48 7.0 (3) Tall Bana 55 * Values estimated from root/shoot ratio of similar forests (1) Uhl & Jordan 1984; (2) Saldarriaga 1985; (3) Sanford 1985; (4) Veillon 1983 from calculations of S. Brown, A. Lugo & J. Chapman (personal communication); (5) Buschbacher 1984; (6) Klinge & Herrera1983, eliminating outlier plots as suggested by authors; (7) Bongers, Engelen & Klinge 1985, in open Bana non woody components contribute substantially to LAI.
Nutrient inventory in living vegetation and soil in a mixed forest on oxisol. Values in kg ha-1 Compartment N P K Ca Mg Vegetation (1) Leaves 160 5.1 37.7 11.5 6.1 Stems 785 26.0 207.2 194.1 49.3 Roots 540 17.1 43.1 45.4 11.6 Total living 1,485 48.2 288.0 251.0 67.0 Fine litter 109 2.1 8.3 3.4 1.9 Dead Wood 128 1.1 3.4 6.6 2.5 Depth cm --------Total---------- ----Exchangeable cations---- Soil (1) 10 1,474 210.6 19.8 6.0 4.5 (2) 48 --- --- 67.7 41.9 24 (3) root depth 3,507 --- --- --- --- (4 root depth --- --- --- 56.4 --- (5) ? 1,739 250 25 14 --- (6) 20 2,722 --- 47 8 7 (1) Uhl &Jordan, 1984: biomass data substitute earlier values given in Jordan & Uhl, 1978. Soil nutrient values were calculated from an independent sample to that cited in Jordan 1982. Cations extracted with double acid solution. (2) Stark & Spratt 1977. Cations extracted with ammonium acetate. (3) Jordan et al. 1982. (4) Herrera 1986. (5) Calculated from Fig. 2.1 in Jordan 1987. (6) Sanford 1986.
Nutrient inventory of tall Amazon caatinga*. Values in kg ha-1 Compartment N P K Ca Mg Leaves 70 3.9 39 16.5 16.5 Stems 341 36 362 286 46 Roots 734 61 288 215 125 Total 1,145 101 689 518 188 Fine litter 52 3 6 33 16 Dead wood 80 2 4 34 6 Soil Depth Bulk density ---Total---- ---Exchangeable----- 0-21 cm 0.235 716 21 64 118 14 21-40 cm 0.902 70 15 5 15 0.2 Total 786 36 69 133 14 *Original data in Herrera 1979, Herrera & Jordan1981and Herrera 1986 have been modified to accommodate changes in average biomass data of tall Amazon caatinga in Klinge & Herrera 1983.
Mean (± s.d.) specific leaf area (SLA cm2 g-1) and nutrient concentration (mg g-1) of leaves from different forest types near San Carlos de Río Negro (Medina 1984) Nutrient concentration . Forest Type No. SLA N P K Ca Mg species Mixed forest 7 74 (12) 12.7 (2.7) 0.60 (0.30) 4.6 (1.2) 1.9 (0.7) 1.0 (0.2) Tall caatinga 6 76 (33) 11.6 (4.6) 0.73 (0.19) 6.2 (1.1) 4.4 (1.6) 1.5 (0.5) Low caatinga 14 47 (12) 7.4 (2.4) 0.50 (0.17) 6.4 (3.0) 5.8 (3.4) 1.4 (0.3) (low bana)
Nutrient concentration (mg g-1) in fine roots grown in vermiculite-filled cylinders inserted in the upper 10 cm of soil in several forests near San Carlos de Río Negro. Numbers followed by the same letter in a column are not statistically different at p=0.05 (Medina & Cuevas 1989) Forest type N P K Ca Mg Mixed forest 23.8 a 1.13 a 6.7 a 2.1 a 2.6 a on oxisol Tall Caatinga 10.4 b 0.95 a 8.3 ab 3.0 a 3.9 b Low Caatinga 8.4 b 0.51 b 12.2 b 3.5 a 3.7 b
Mean (± s.e.) nutrient concentration (mg g-1) in freshly fallen leaf litter in several forests types near San Carlos de Río Negro. Values are averages of10 collection periods (every 3 weeks) with 15 baskets per collection.(Medina & Cuevas 1989) Forest type n N P K Ca Mg Mixed forest 54 16.3 (1.7) 0.32 (0.08) 2.4 (0.5) 1.7 (0.4) 0.7 (0.1) on oxisol Guaco forest 10 12.2 (0.9) 0.26 (0.03) 1.3 (0.1) 1.8 (0.3) 0.9 (0.1) Tall Caatinga 54 7.0 (0.6) 0.50 (0.14) 2.1 (0.7) 7.7 (1.8) 3.1 (0.3) Low Caatinga 54 5.8 (1.3) 0.21 (0.06) 4.7 (1.6) 7.4 (2.1) 2.5 (0.3)
Differences in mass, nutrient content and nutrient fluxes in fine litterfall in Amazonian forests (upper Río Negro basin, Cuevas and Medina 1986) Forest type Leaf litter N P K Ca Mg (g m-2 yr-1)(s.e.) Tierra Firme 757 (24) Concentration (mg g-1) 16.2 0.3 2.4 1.7 0.7 Flux (g m-2 yr-1) 12.1 0.21 1.5 1.3 0.5 Tall Caatinga 399 (19) Concentration (mg g-1) 7.0 0.5 2.1 7.7 3.1 Flux (g m-2 yr-1) 2.8 0.20 0.8 3.1 1.3 Low Caatinga 207 (18) Concentration (mg g-1) 5.8 0.2 4.7 7.4 2.5 Flux (g m-2 yr-1) 1.2 0.04 1.0 1.5 0.5
Determination of CO2 concentrations within rainforests of the Río Negro basin Method: absorption in calibrated hydroxide mixtures; in parenthesis number of replicates
Some Conclusions • Distribution of N and P between living tree biomass and soil differentiates mixed forests on oxisols and ultisols (tierra firme) and caatinga complex forests (Tall Caatinga and Bana). In the former around 30% of total N and 19% of total P are found in living biomass, corresponding figures in guaco forests are 42 and 11%. In tall caatinga living biomass contains 59% of total N and 74% of total P in the ecosystem. • Phosphorus is a limiting nutrient in all non-flooded (tierra firme) forests and in the less flood-prone areas of the caatinga complex forests. • The tall caatinga and tall bana units accumulate and circulate larger amounts of P, and have N/P ratios comparable to those of forests in nutrient-rich sites. • Nitrogen is accumulated and circulated in larger amounts in tierra firme forests, but limits decomposition rates and root growth in the caatinga complex.
Conclusions II • Tierra firme forests have lower concentrations of K, Ca, and Mg, compared to caatinga complex forests. • The higher levels of K, Ca, and Mg in caatinga is probably due to cation leaching from adjacent forests in higher topographical positions. • Direct nutrient cycling appears to be operative in the root mat of both mixed and caatinga forests. • Mycorrhizal symbiosis plays an important role in nutrient cycling as judged from the frequency and intensity of infection. • Efficiency of the nutrient trapping process might be well correlated with the density of fine root development in the upper soil layers, or even above the soils as is the case in non-flooded forest on oxisol and ultisols.