Data Manipulation for Temperature Anomaly Analysis
Learn how to manipulate and analyze temperature anomaly data, subtract baselines, and apply moving averages for insightful results. See trends and consensus in global temperature data sets.

Data Manipulation for Temperature Anomaly Analysis
E N D
Presentation Transcript
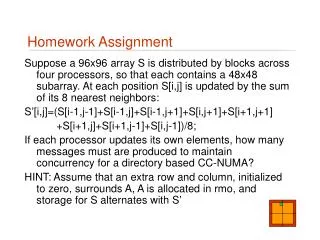
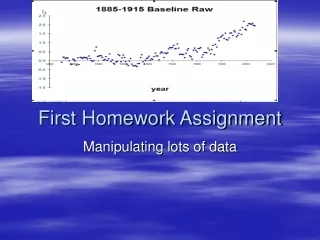
First Homework Assignment Manipulating lots of data
Subtracting Baselines • Temperature anomaly for a year is simply that year’s temperature minus some constant that was obtained from your baseline averaging. • The waveform is unaltered, only the zero level (or intercept) is changed • 1900 baseline average temperature is 0.9 C lower than 1961-1990
Slopes and Scatter • Slopes are in degrees C per decade • 1970: 0.22 +/-0.016 +/- 0.11 • 1915: 0.11 +/-0.005 +/- 0.16 • All: 0.06 +/-0.003 +/- 0.21 • 100: 0.10 +/-0.005 +/- 0.16 • 50: 0.18 +/-0.001 +/- 0.12 • 25: 0.20 +/-0.005 +/- 0.11
95% Confidence Temps in 2050 • All: 0.26 +/- 0.46 (relative to 2007) • 100: 0.46 +/- 0.37 • 50: 0.79 +/- 0.34 • 25: 0.86 +/- 0.24 • 1970 0.95 +/- 0.37 • 1915: 0.45 +/- 0.36 • Data is consistent with claim that 2050 temp will be 1-1.2 C (1.8-2 F) higher than now !
Global mean temperature (our values are slightly higher due too urbanization correction in the data) • Contamination and data reliability/correction problems render this approach the least convincing • This is reflected in the relatively large error bars on overall amplitude of warming
Consensus in Data Sets • But different analyses use different sets of thermometers and different selection criteria • Statistical agreement is good
Chi^2 • This was tricky and confusing • You need to compare data on a year by year basis • Pay attention to what happens on the whiteboard now • Chi^2 per degree of freedom for 1970 =1.53 • Chi^2 per degree of freedom for 1915 = 2.40
Central Europe Summer Signal • Huge statistical signal via baseline/area test
Baseline Variations • 1700-1750 15.94 4.41 • 1725-1775 15.91 4.21 • 1750-1800 15.93 3.92 • 1775-1825 15.82 3.98 • 1800-1850 15.57 4.15 • 1825-1875 15.67 4.32 • 1850-1900 15.67 4.39 • 1875-1925 15.44 4.56