Download
1 / 14
140 likes | 157 Views
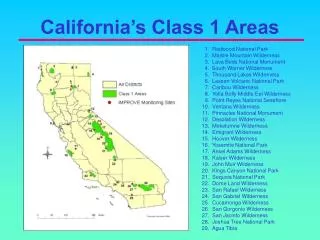
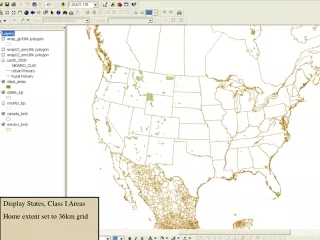
Display States, Class I Areas Home extent set to 36km grid. Zoom rectangle tool. Class I Areas labeled when zoomed beyond 1:5,000,000 Counties appear when zoomed beyond 1:5,000,000. Zoom further in. Roads appear when zoomed beyond 1:2,000,000. Turn on gridded emissions layer for VOC.

E N D
Display States, Class I Areas Home extent set to 36km grid
Class I Areas labeled when zoomed beyond 1:5,000,000 Counties appear when zoomed beyond 1:5,000,000
Identify by grid cell to get gridded emissions values (all pollutants shown)
Zoom in and identify by grid cell to get gridded emissions values (all pollutants shown)
Zoom in and identify by county to get county emissions values (all pollutants shown)
View zoomed area with grid cells displayed; could be used for selecting a grid cell but actually querying county-based emissions
Potential Data Items for Identify Tool • CMAQ model input emissions by grid cell (shown here) • SMOKE emissions summary by county (shown here) • SMOKE emissions summary by grid cell • SMOKE emissions summary by state • IDA file emissions by county (FIPS) or state • Model output concentrations by grid cell Based on grid cell IJ (for domain of interest), county FIPS or state FIPS Related data tables One pollutant at a time vs. All pollutants at once