Download
1 / 41
410 likes | 682 Views
Dnyanasadhana College, Thane. Department of Chemistry M.Sc. Analytical Chemistry Sem -II In fra-red Spectroscopy Ion selective Potentiometry. INFRARED ABSORPTION SPECTROSCOPY. Syllabus Instrumentation, FTIR, Advantages of FTIR, Applications of IR,

E N D
Dnyanasadhana College, Thane.Department of ChemistryM.Sc. Analytical Chemistry Sem-IIInfra-red SpectroscopyIon selective Potentiometry
INFRARED ABSORPTION SPECTROSCOPY Syllabus • Instrumentation, • FTIR, • Advantages of FTIR, • Applications of IR, • Qualitative and quantitative analysis, • Advantages and limitations of quantitative IR methods.
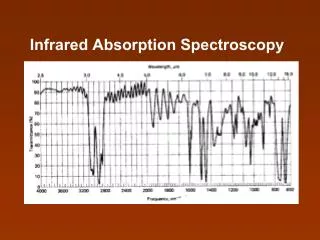
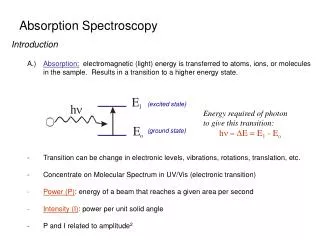
INTRODUCTION: • Infrared Spectroscopy is a powerful tool for identifying pure organic and inorganic compounds with the exceptions of few molecular compounds such as O2, N2, and Cl2. At temperature above absolute zero, all atoms in molecules are in continuous vibration with respect to each other .When the frequency of specific vibrations are equal to the frequency of the IR radiation directed on the molecule, the molecules absorb IR radiation.
154 pm 10 pm 10 pm 4o What is vibration stretching vibration For a C-C bond with a bond length of 154 pm, the variation is about 10 pm. bending vibration For C-C-C bond angle a change of 4o is typical. This moves a carbon atom about 10 pm.
Bond length 154 pm, 10 pm. For a C-C bond with a bond length of 154 pm, the variation is about 10 pm.
C C 10 pm 4o C For C-C-C bond angle a change of 4o is typical. This moves a carbon atom about 10 pm.
How does the mass influence the vibration? H2 I2 MM =2 g/mole MM =254 g/mole The greater the mass - the lower the wave number
Radiation source: • The various sources of radiation source are used in I.R. • Nernst Glower: A Nernst glower is heated to 1500-2000oc to get infrared radiation. Nernst glower is a rod containing a mixture of zirchonium,yttrium and erbium oxides. Platinum leads are sealed into two ends of rods. The Nernst Glower is 2 cm long and has diameter of 1.5 mm.Its IR output decreases with temperature.
Glober Rod: • TheGlober rod is silicon carbide rod(SiC) which on heating to 15000C emits IR radiation. Its disadvantage is that SiC gets easily oxidized hence it has shorter life than Nernst Glower; However its advantage is that Its IR output increases with increase in temperature.
Carbon dioxide Laser Source: • For measurements in the middle-infrared region, 2.5-50 PM, there are several differences between the instruments used for UV/visible Spectrophotometry and those designed for infrared determinations. These changes are mainly dictated by the fact that glass and quartz absorb strongly in the infrared region and photomultipliers are insensitive to the radiation. Front-surfaced mirrors are largely employed to avoid the necessity of radiation passing through glass or quartz layers as reflection from metallic surfaces is generally very efficient in the infrared region. But absorption cells and windows must be fabricated from infrared transparent materials.
Sample Cells: • 2 a) Sample Cells: • The sample cells of metal halide like NaCl and KBr are generally used. • Quartz and glass are not used because it absorbs strongly in IR region.
2 b) Sample Handling System: • The solvent used for preparation of sample solution should not absorb IR radiation. • All solvents are dried to remove moisture before used. • Solvents commonly used in IR studies are hexane, Chloroform, carbon tetrachloride, Dioxane, carbon disulphide, ethanol ,methanol and in rare case benzene. • The solution concentration range from0.1% to 10%.
Sample handling and preparation • Gaseous sample: Gaseous sample are taken in 10 cm long cells provided with NaCl windows which are transparent to IR radiation. • Liquid samplesare pressed between two NaCl plates which are held together by capillary
Sampling cuvettes for a) gaseous and b) liquid samples Gaseous Sample Liquid samples
For Solid samples following two methods are used . • KBr Pallet Method: An alkali halide (AR Grade ) KBr pallet is prepared by grinding 1 mg of sample with 100-200 mgs of KBr. • The pallet is dried to remove moisture and pressed under high pressure into small transparent disc of 10 mm and thickness 1-2 mm. • The disc can directly used in sampling area of the spectrophotometer. • Mull Method: A mull is prepared by grinding 5 mgs of sample of solid sample with few drops of mulling oil. • The mulling oil commonly used is is high boiling petroleum oil called nujol. • The mull is then pressed between two NaCl windows.
Detector: • The various detectors used in IR spectroscopy are as ; • Thermocouple • A bolometer • The Golay pneumatic detector
The Thermocouple: • The Thermocouple: It is made by welding together two wires of metals 1 and 2 in such a manner that a segment of metal 1 is connected to two terminal wires of metal 2. One junction between metals 1 and 2 is heated by the infrared beam, and the other junction is kept at constant temperature: small changes in ambient temperature are thus minimized. To avoid losses of energy by convection, the couples are enclosed in an evacuated vessel with a window transparent to infrared radiation. The metallic junctions are also covered with a black deposit to decrease reflection of the incident beam
A Bolometer:- • A bolometer is essentially a thin blackened platinum strip in an evacuated glass vessel with a window transparent to the infrared rays: it is connected as one arm of a Wheatstone bridge, and any radiation absorbed raises the temperature of the strip and changes its resistance. Two identical elements are usually placed in the opposite arms of a bridge; one of the elements is in the path of the infrared beam and the other compensates for variations in ambient temperature. Both the above receptors give a very small direct current, which may be amplified by special methods to drive a recorder.
The Golay Pneumatic Detector • It is sometimes used, consists of a gas-filled chamber which undergoes a pressure rise when heated by radiant energy. • Small pressure changes cause deflections of one wall of the chamber, this movable wall also functions as a mirror and reflects a light beam directed upon it to a photocell, the amount of light reflected bearing a direct relation to the gas-chamber expansion, and hence to the radiant energy of the light from the monochromator. • This detector responds to the total light energy received as distinct from energy received per unit area (thermocouples and bolometers). • When infrared radiation is incident on the detector there is a change in polarisation which can be employed to produce an electrical signal. The detector will only produce a signal when the intensity of the incident radiation changes. • These detectors are of especial value in FT-IR where rapid response times are needed and for this purpose they use deuterium triglycinesulphate as the detecting medium in an evacuated chamber.
In FT IR instruments, Instruments collect the response at all the wavelengths simultaneously. In these multiplex instruments the monochromator is replaced by an Interferometer and the response of the sample to the whole range of IR radiation is suitably modulated and collected in the time domain. • These are then decoded using the Fourier transformation. Therefore it is named the Fourier transform infra red spectrometer (FT-IR). • The basic instrument design for an FT-IR instrument is quite simple. A schematic diagram showing different components is given in Fig. • The IR radiation from the source is first directed into an interferometer from where it is passed through the sample compartment and then it reaches to the detector.
Interferometers as wavelength selector In FTIR Spectroscopy: • A device that allows all wavelengths of light to be measured simultaneously, eliminating the need for a wavelength selector interferometer simultaneously allows source radiation of all wavelengths to reach the detector. Radiation from the source is focused on a beam splitter that transmits half of the radiation to a fixed mirror, while reflecting the other half to a movable mirror. • The radiation recombines at the beam splitter, where constructive and destructive interference determines, for each wavelength, the intensity of light reaching the detector. • As the moving mirror changes position, the wavelengths of light experiencing maximum constructive interference and maximum destructive interference also changes. • The signal at the detector shows intensity as a function of the moving mirror’s position, expressed in units of distance or time. The result is called an interferogram, or a time domain spectrum. The timedomain spectrum is converted mathematically, by a process called a Fourier transform, to the normal spectrum (also called a frequency domain spectrum) of intensity as a function of the radiation’s energy
Qualitative Applications The most important qualitative application of the mid-IR spectrometry is in the determination of the structures of organic and biochemical species. It is achieved in an empirical method wherein the signals in the IR spectra are identified with the help of correlation tables (briefly discussed below). Besides structure determination, we shall discuss how the IR spectra can be used in establishing the identity of a molecule? And also, how does it help in monitoring the progress of a reaction?
Structure Elucidation of Organic Molecules by IR Spectra • For structure determination of organic molecules, the infrared spectrum can be broadly divided into two regions. • The region spanning from 3600 to 1200 1 cm− is called the functional group region • The region that includes all frequencies below 1200 cm-1 is called the fingerprint region. • The two regions put together are important in the determination of the identity of a molecule. • It is almost impossible to assign all the possible frequencies observed in the IR spectrum. However, identification of the • characteristic features in the functional group region that includes stretching vibrations, of typical functional groups found in organic molecules, is quite important.
Quantitative analysis : • Infrared spectra are recorded using either or both absorbance and percentage transmission just as they are in visible/ultraviolet electronic spectra, and the Beer-Lambert relationship: • for a mixture of compounds the observed absorbance at a particular wavelength (or frequency) will be the sum of the absorbances for the individual constituents of the mixture at the wavelength:
2) Calibration Curve Method: Series of standard solutions and sample are prepared and their absorbance is measured. All standards and samples are measured in the same fixed-path-length cell, although the dimensions of the cell and the molar absorption coefficient for the chosen absorption band are not needed as these are constant throughout all the measurements. From graph concentration of unknown is find out as shown in following graph.
Standard addition methods: These are not widely applied in quantitative infrared spectrophotometry, being limited to determinations of low concentration components in multicomponent mixtures. The solutions are made from a series of increasing concentrations of the pure analyte (similar to a normal calibration graph set of concentrations) but to each is added a constant, known amount of the sample containing the unknown concentration. All the solutions are diluted to a fixed volume and their absorbance’s measured in a fixed-path-length cell by scanning over the chosen absorption band. A plot of the absorbance against the concentration of the pure analyte does not pass through zero as all the absorbance values are enhanced by an equal amount due to the presence of the unknown concentration in the added sample. Extrapolation of the graph back to the abscissa (the horizontal axis) gives the concentration of the unknown as a negative value (Graph)
Other Miscellaneous applications: • i) IR spectroscopy is widely used in both research and industry as a simple and reliable technique for measurement, quality control and dynamic measurement. • ii) IR spectroscopy has been highly successful for applications in both organic and inorganic chemistry. • iii) By measuring at a specific frequency over time, changes in the character or quantity of a particular bond can be measured. This is especially useful in measuring the degree of polymerization in polymer manufacture. • iv) IR spectroscopy is useful for identifying substances and confirming their identity. Therefore it also has a forensic purpose: with the use of IR spectroscopy alcohol, drugs, fibers and paint could be analyzed.
v) IR spectroscopy has also been successfully utilized in the field of semiconductor microelectronics: • for example, this technique can be applied to semiconductors like silicon, gallium arsenide, gallium nitride , zinc selenide, amorphous silicon, and silicon nitride. • vi) Techniques have been developed to assess the quality of tea-leaves using IR spectroscopy.
Advantages of quantitative IR methods. • Any sample in any state can be studied. • Liquid sample solutions ,pastes powders, films fibres, gases and surfaces can be examined with judious choice of sampling technique. • Application of IR spectroscopy varies from laboratory to laboratory to other. • Quanitative analysis is based on Beers Lamberts Law. • Apparent deviations arises from either chemical or instrumental defects.
5) The baseline technique involves selection of an absorption band of the substance under analysis. 6) The transmittance speed is measured at point of maximum absorption. 7) The value of Po is plotted against concentration 8) Many possible error are eliminated by base line technique. 9) The same cell is used for all determination
limitations of quantitative IR methods. • Molecular weight of substance is not determined by this technique. • It is frequently non-adherence to Beers Law of Complexity spectra. • Narrowness of spectra and effect of stray ray radiations make the measurements of absorbance upon slit width and wavelenght setting.
4) Generally IR spectroscopy does not provide information of the relative positions of different functional groups in a molecule. 5) From single IR spectrum of an unknown substance ,It is not possible to know whether pure compound or mixture of compound,For Ex. Mix. Of parafin and alcohol will give the same IR spectra as high molecular weight of alcohol.