Download
1 / 71
710 likes | 845 Views
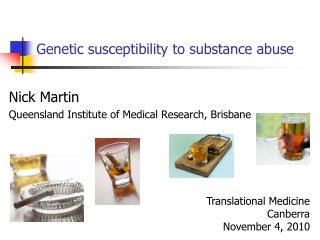
Connecting biobanks - adding value in the genetics of complex traits The Australian Twin Collections Biobank. Nick Martin Queensland Institute of Medical Research Brisbane MRC CAiTE Symposium Bristol January 12, 2011. My brief…. how biobanks can be beneficial for researchers

E N D
Connecting biobanks - adding value in the genetics of complex traitsThe Australian Twin Collections Biobank Nick Martin Queensland Institute of Medical Research Brisbane MRC CAiTE Symposium Bristol January 12, 2011
My brief… • how biobanks can be beneficial for researchers • what’s happening and what is accomplished • some results of projects I’m involved in
How beneficial biobanks can be for research[ers] (1) 1 page of authors and affiliations!
How beneficial biobanks can be for research[ers] (2) 2 pages of authors and affiliations !
Australian Twin Registry • Founded 1978 • Voluntary enrolment – schools, media, etc • ~30,000 pairs enrolled (~15% of all pairs) • Two adult cohorts studied • 1893-1964 (5967 pairs), 1965-1971 (4629 pairs) • Typical of population wrt psychiatric symptoms, personality, social class & education (females) • Males slightly more educated and middle class • New cohort of ~8000 pairs (born 1972-85)
Timetable of Questionnaires and Interviews Cohort 1 DSM-IIIR MD, PD 2456 p / 771 s N23, A, D 3808 p / 576 s N12, A, D 3051 p / 468 s N23, CIDI 894 N12, A, D 1279 p / 558 s Cohort 2 N23, CIDI 404 N12, A, D 2270 p / 518 s Siblings N23, CIDI 1172 N12 5375 Parents N12 6014 765 1980 1985 1990 2000 1995
QIMR GenEpi core interests Quantitative phenotypes related to disease risk: Metabolic / cardiovascular risks Biochemical test results Lipids Glucose, insulin Urate, CRP, ferritin Liver enzymes GGT, ALT, AST, BCHE Personality, depression, anxiety, cognition, MRI, taste, smell Addictions (alcohol, nicotine, cannabis, opioids, gambling) Melanoma; endometriosis; asthma; migraine; twinning
Data (Twins and families) • Biochemical phenotypes N ≈ 19,000 adults • N ≈ 2,500 adolescents • GWAS N ≈ 20,000 ENGAGE participation • Meta-analysis of lipids, urate, alcohol, liver function tests, glucose • Meta-analysis of iron markers, transferrinisoforms
Queensland Twin Registry Adolescent twins + sibs
Phenotypes measured on teenage twins included; - no information 12yrs 14yrs 16yrs Sun exposure - Sun protective behaviour - Mole counts and locations - Melanoma family history - Mosquito bite susceptibility - Mouth ulcers - Sociodemographic Variables Eye, hair and skin colour Personality (JEPQ, NEO) Acne Height, weight Blood pressure Fingerprints, handprints
12yrs 14yrs 16yrs Photoaging (skin mould) Visual acuity AutoRefractometry (myopia) ENT (grommets, T&A) Asthma, eczema Laterality (hand, eye, foot) Hand preference (peg board) Binocular rivalry (bipolar) - Computer Use -- Reading Ability (CCRT) -- Cognitive Ability (IQ – MAB) -- Information Processing (IT) -- Working Memory (DRT) -- ERPs (DRT) -- EEG (power, coherence) -- Academic achievement (QCST) -- Taste (PTC, bitter, sweet) Smell (BSIT, NatGeo) -- Psychiatric signs (SPHERE) Relationships -- Leisure activity --
Blood phenotypes 12yrs 14yrs 16yrs Haemoglobin Red blood cell count Packed cell volume Mean corpuscular volume Platelet count White blood cell count Neutrophils Monocytes Eosinophils Basophils Total lymphocytes CD3+ T-cells CD4+ helper T-cells CD8+ cytotoxic T-cells CD19+ B cells CD56+ natural killer cells CD4+/CD8+ T-cell ratio Blood groups (ABO, MNS, Rh) - -
Serum biochemistry 12yrs 14yrs 16yrs Cholesterol, HDL, LDL Triglyceride Apolipoproteins A1,A2.B,E Lp(a) Glucose, Insulin Ca, PO4 Creatinine Urea, Uric acid Alkaline phosphatase Albumin, Bilirubin AST, ALT, GGT Fe, Ferritin, Transferrin Heavy metals (Pb, As etc)
Population 21 million Area 7.7 million km2
External blood collection: Labmailer Process Preparing Labmailers Preparing FTA cards Biobottle Box Incoming Blood Samples Receipting the blood sample
Standard blood collection and processing Samples are collected in the following tubes: 2 x EDTA 1 x SERUM 1 x ACD 1 x PAX 1 x BUCCAL MNC Processing Buccal Extraction 4 x Red Blood Cells 4 x Serum The 2 x EDTA & 1 x SERUM tubes are centrifuged at 3000rpm for 10mins and then the fractions are collected. All fractions & 1 x Buffy Coat are stored in the -80oC freezers Stored in Freezer for later RNA work 4 x Plasma 2 x Buffy Coats 1 x Buffy Coat Extraction
Average DNA Yield per buffy coat (10ml EDTA blood collection) Mean = 171.291 Std. Dev = 68.5431 N = 3,554
Genetic Epidemiology Frozen sample inventory
Genetic Epidemiology DNA sample inventory
Australia’s changing ethic composition
Published Genome-Wide Associations through 6/2010 904 published GWA at p<5x10⁻⁸ for 165 traits NHGRI GWA Catalog www.genome.gov/GWAStudies
(Most) genetic effects are modest • Genetic risks for complex traits are modest • A genetic risk (OR) of 1.3 (2% variance) is large • Most genetic risks are in the 1.1 to 1.2 range or less (<1% variance) • This is true for most complex diseases (e.g. alcoholism, schizophrenia, bipolar disorder, lung cancer) and traits (height, BMI, lipids) BUT not always………….(use your Biobank !)
Serum Bilirubin • a waste product of the normal breakdown of red blood cells • excreted from the body after being conjugated with glucuronic acid ~ UGT (UridineDiphosphateGlucuronyltransferase) enzyme • a diagnostic marker of liver and blood disorders • acts as an antioxidant: an increase in bilirubin levels is associated with a reduced risk of cardiovascular diseases
Bilirubin in adolescents rs2070959
Genetics of Iron Status • What genes affect iron status (e.g. serum iron, transferin, saturation, ferritin), and the risk of either deficiency or overload in general population?
GWAS (N = 8942) Serum iron TMPRSS6 P = 7E-27 HFE P = 5E-38 TF P = 3E-104 HFE P = 1E-73 Transferrin HFE P = 8E-83 TMPRSS6 P = 2E-27 Tf saturation ZNF521 (Zinc Finger Protein 521) P = 4E-08 HFE P = 4E-12 Ferritin
Large effects of TF and HFE variants ENGAGE meta-analysis to find more iron metabolism genes
Butyrylcholinesterase (BCHE) Correlations ≥ 0.25 for: BMI Blood pressure ApoB ApoE Total cholesterol Triglycerides GGT + significant but smaller correlations for ALT, AST, HDL-C, LDL-C, urate. • Enzyme found in plasma • Rare variants in BCHE extensively studied because of pharmacogenetic effects • Evidence of involvement with T2DM, CVD, Alzheimer disease (questionable)
Cholinesterase GWAS Meta-Analysis (3 studies, total N = 8781)
QQ Plots Before and AfterAdjustment for the BCHE K Variant – many other variants contributing…….
Ingenuity Pathway Analysis on all butyrlcholinesterase GWAS data All SNPs with p ≤ 0.001 (Total 5662, of which 2003 mapped to 440 genes)
CD4+/ CD8+ ratio h2 = 0.84 (0.79–0.87)
Hair curliness – straight, wavy, curly λ = 1.00008
GWAS for curliness in three independent Australian Cohorts P = 10-31 Other peaks
GWAS for hair curliness ~6% variance
Heterogeneity of gene effects by age, and sex...and environment?
Liver function: gamma glutamyltransferase (GGT) Several significant hits in the combined data, but not the expected one on Chr. 22 ? Heterogeneity between adult and adolescent results at this locus!
Multiple SNPs show heterogeneity between adult and adolescent results for GGT
Melanocytic naevi (common moles) The largest risk factor for melanoma
QIMR GWAS for total, flat and raised nevi IRF4 MTAP Note inverse association signals for MTAP and IRF4 with flat and raised nevi