Download
1 / 34
350 likes | 477 Views
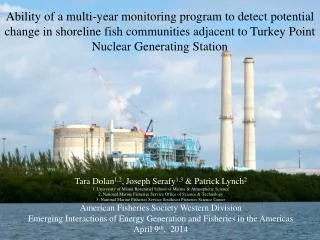
Ability of a multi-year monitoring program to detect potential change in shoreline fish communities adjacent to Turkey Point Nuclear Generating Station. Tara Dolan 1,2 , Joseph Serafy 1,3 & Patrick Lynch 2 1. University of Miami Rosenstiel School of Marine & Atmospheric Science

E N D
Ability of a multi-year monitoring program to detect potential change in shoreline fish communities adjacent to Turkey Point Nuclear Generating Station Tara Dolan1,2, Joseph Serafy1,3 & Patrick Lynch2 1.University of Miami Rosenstiel School of Marine & Atmospheric Science 2. National Marine Fisheries Service Office of Science & Technology 3. National Marine Fisheries Service Southeast Fisheries Science Center American Fisheries Society Western Division Emerging Interactions of Energy Generation and Fisheries in the Americas April 9th, 2014
Introduction 11,000 acre property 2nd largest power plant in Florida and 6th largest in the United States (EIA 2012) 25 miles south of Miami Borders parts of Biscayne National Park Borders parts of Biscayne Bay Aquatic Preserve Less than 20 miles east of Everglades National Park FPL 2009
Brief history of Turkey Point Nuclear Generating Station: • Units 1 & 2 – April 1968 • Units 3 & 4 completed by 1972 • Open cycle cooling system used from 1967-1973 • July 1967- 1973: fish & benthic community impacts due to thermal effluence repeatedly documented • (FWPCA 1970, Nugent 1970, Zieman & Wood 1975, Thorhaug et al. 1974, etc.) U.S. Department of Commerce, 1970 • 1973 – Closed-cycle cooling canal system begins operating.
Units 6 & 7 Expansion • 2009- FPL submits COL application for Units 6 & 7 • Estimate operational date: 2019 • Est. total project cost $12.1-$17.8 billion FPL 2009 • 1117 MWt Westinghouse AP 1000 • 6 Mechanical draft cooling towers • Primary source: 90 mgd of reclaimed municipal wastewater • Secondary source: up to 125 mgd from radial collector wells 40 ft below Biscayne Bay FPL 2009
Power Analysis of the Shoreline Fish Community Visual Assessment (SFCVA)
Power analysis: • Can improve both rigor and efficiency in environmental monitoring • Is underutilized in environmental impact studies (Smith 1993, Underwood & Chapman 2003) • Can aid in preventing a Type II error (false negative) (Peterman 1990) • Can inform a cost-benefit analysis for monitoring design (Fairweather 1991) (Photo: E. D’allessandro, Univ. Miami)
Mangrove fish communities are useful indicators (& managed resources too!) • Biscayne Bay mainland mangrove fringe is Essential Fish Habitat for several species of commercial & recreational importance (SAFMC 2009) • Integrative indicators of environmental condition (Karr 1981, Harrison & Whitfield 2004, Browder et al. 2005, Nagelkerke & van Densen 2007, Pérez-Domínguez et al. 2012, IBEAM 2013) • show rapid response time to physiochemical changes(Haake & Dean 1983, Lorenz 1999, Serafy et al. 1997, Lorenz & Serafy 2006) • In Biscayne Bay, FL: taxonomic richness and total fish density have documented relationships with salinity (Ley et al. 1999, Lorenz 1999, Serafy et al. 2003, 2005; Green et al. 2006, Lorenz & Serafy 2006) Gray snapper among the mangrove prop roots in Biscayne Bay. Photo by JiangangLuo (University of Miami)
Design • Biannual (wet & dry seasons) • Stratified random (shoreline segments) • Visual belt-transect fish surveys 30 m 2 m SFCVA Field Methods • Habitat • Depth • Temperature • Salinity • Fishes • Species/Taxon • Number • Total length • (Min, Mean, Max) • timeline • analyzed data from 2005-2012 Methods follow Serafy et al. 2003. Slide graphics credit: Joe Serafy
DataAnalysis • Power analysis on a paired, two-sided Student’s t-statistic. • Taxonomic richness • Total fish density (LN transformed) • Power of two sided binomial test of proportions • Frequency of occurrence of gray snapper (Lutjanusgriseus) • Frequency of occurrence of goldspotted killifish (Floridicthyscarpio) • Three study areas • SA1, SA2, SA3 • Season (Wet vs. Dry) • Time period: used data collected between 2005 and 2012 to construct an ‘average year’ pooled across seasons. Photo: JiangangLuo
SA-1 531 surveys (2005-2012) 264 dry season 267 wet season 53 species Largest study area in nested subset design.
SA-2 307 surveys (2005-2012) 151 dry season 156 wet season 41 taxa Combined Operating License Application Rev. 2. (FPL 2010) “No adverse impacts” – Draft EFH Assessment Salt deposition to surrounding habitat has been studied at other thermoelectric plants (Miner & Warrick 1974, Shrecker et al. 1975, Talbot 1979, Lin et al. 1994, Brujis & Jenner 2012)
SA-3 Smallest study area 125 surveys (2005-2012) 62 dry season 63 wet season 25 taxa 16 families Radial collector wells are the secondary water supply system for the proposed cooling towers. 0.55 ppt average salinity difference modeled within predicted radius while wells are operating (FPL 2010) “Minimal impacts expected, but localized, temporary substantial adverse impacts could occur from increased salinity in nearshore areas near the Turkey Point site” – Draft EFH assessment • Site Certification Application (Florida Power & Light Co. SCA, Chapter 5, Figure 5.1.3-1)
Taxonomic Richness: SA1 (entire property) n =33/season-yr SA2 (cooling towers) n= 20/season-yr SA3 (collector wells) n= 8/season-yr Y axis = number of samples X axis = effect size • Can detect most subtle change in SA1 • More efficient to sample during the wet season • Current sampling intensity appropriate for detecting medium effect sizes • Increase # of samples for a focused study on SA3.
Total Fish Density: SA1 (entire property) n =33/season-yr SA2 (cooling towers) n= 20/season-yr SA3 (collector wells) n= 8/season-yr • Can detect most subtle change in SA1 • More efficient to sample during the wet season, except in SA3. • Current sampling intensity appropriate for detecting medium effect sizes • Increase # of samples for a focused study on SA3.
Occurrence of gray snapper (Lutjanusgriseus) • Commercially and recreational important managed species for which EFH occurs near Turkey Point. • Accounts for ~ 11% of total landings in Biscayne National Park (Harper et al. 2000, SAFMC 2010) • Tertiary consumer (Stark 1970, Harrigan et al 1989) • Indicator species for assessing water quality in BNP (Robles et al. 2005, from draft EFH Assessment) • Most frequently encountered in the wet season (Serafy et al. 2003). • Southern Biscayne Bay retains importance during dry season (Serafy et al. 2007) • Demonstrated avoidance behavior of salinities > 30 and < 5 ppt. • Selection behavior for 9-23 ppt. (Serrano et al. 2010) Photo: JiangangLuo
Occurrence of gray snapper: SA1 (entire property) n =33/season-yr SA2 (cooling towers) n= 20/season-yr SA3 (collector wells) n= 8/season-yr • Detect most subtle change in SA1 • Most efficient during the wet season when gray snapper are most frequently encountered. • Sampling intensity must be increased in order to detect changes of smaller effect size. • It is important to consider what levels of sampling are feasible.
Occurrence of goldspotted killifish(Floridichthyscarpio) • Important forage species for predatory fish, wading birds and crocodilians (Schmidt 1989, Crabtree et al. 1990, Ramo & Busto 1993, Villegas & Schmitter-Soto 2008, Hammerschlag et al. 2010) • Most frequently encountered in the dry season (Serafy et al. 2007). • Demonstrated avoidance behavior of salinities > 40 ppt. • Selection behavior for 13-24 ppt. (Lorenz & Serafy 2006, McManus et al. 2014)
Occurrence of goldspotted killifish: SA3 (collector wells) n= 8/season-yr SA1 (entire property) n =33/season-yr SA2 (cooling towers) n= 20/season-yr • Greatest efficiency of scale found in SA1 the largest sampling area. • Sampling is most efficient during the dry season when killifish are most frequently encountered. • Sampling intensity must be increased in order to detect changes of smaller effect size. • It is important to consider what levels of sampling are feasible.
Conclusions Further investigations: • BACI design • One-sided test (if direction of effect is known). • Adding additional years of post-construction sampling. • It’s up to managers & to decide relevant effect sizes! • Spatial scale • Suited to detect potential community level changes in larger study areas SA1 & SA2 • Sampling intensity must be increased for a focused study on SA3 (the radial collector wells). • Choice of relevant ecological metrics • Better suited to community level metrics • Sampling intensity could be increased (within reason) to detect species-level change. • Season • Richness and density metrics more efficiently detected in the wet season. • However, limiting sampling effort to the wet season may limit ability to detect trends in species which are more prevalent during the dry season, such as goldspotted killifish.
Acknowledgements Co-authors: Joseph Serafy, Patrick Lynch Contributors: Brian Teare, Simeon Yurek, Lisa McManus, Mike South and many others
References • Lorenz, J.J., 1999. The response of fishes to physiochemical changes in the mangroves of Northeast Florida Bay. . Estuaries 22, 17. • Smith, H.M., 1896. Notes on Biscayne Bay Florida, with a reference to its adaptability as the site of a marine hatching and experiment station. , Report of the Commissioner for the year ending June 20, 1895. United States Commission of Fish and Fisheries, Government Printing Office, Washington, D.C. • Serafy, J.E., Faunce, C.H., Lorenz, J.J., 2003. Mangrove shoreline fishes of Biscayne Bay, Florida. B Mar Sci 72, 19. • Lorenz, J.J., Serafy, J.E., 2006. Subtropical wetland fish assemblages and changing salinity regimes: implications for Everglades restoration. . Hydrobiologia 569, 21. • Serrano, X.M., Grosell, M., Serafy, J.E., 2010. Salinity selection and preference of the gray snapper Lutjanusgriseus: field and laboratory observations. J Fish Biol 76, 16. • Haake, P.W., Dean, J.M., 1983. Age and growth of four Everglades fishes using otolith techniques. . South Florida Research Center, Everglades National Park, Homestead, Florida. • Ramo, C., Busto, B., 1993. Resource use by herons in a Yucatan wetland during the breeding season. The Wilson Bulletin 105, 13. • Schmidt, T.W., 1989. Food habits, length-weight relationship and condition factor of young Great Barracuda, Sphyraena barracuda (Waldbaum), from Florida Bay, Everglades National Park, Florida. B Mar Sci 44, 7. • Crabtree, R.E., Stevens, C., Snodgrass, D., Stengard, F.J., 1998. Feeding habits of bonefish, Albulavulpes, from the waters of the Florida Keys. Fisheries Bulletin 96, 12. • Hammerschlag, N., Ovando, D., Serafy, J.E., 2010. Seasonal diet and feeding habits of juvenile fishes foraging along a subtropical marine ecotone. Aquatic Biology 9, 11. • Peterson, M.S., Musselman, N.J., Francis, J., Habron, G., Dierof, K., 1993. Lack of salinity selection by freshwater and brackish populations of juvenile Bluegill Lepomismacrochirus Rafinesque. Wetlands 13, 5. • Lankford, T.E., Targett, T.E., 1994. Suitability of estuarine nursery zones for juvenile weakfish (Cynoscionregalis): effects of temperature and salinity on feeding, growth and survival. Marine Biology 119, 9. • Cardona, L., 2000. Effects of salinity on the habitat selection and growth performance of Mediterranean flathead grey mullet Mugilcephalus (Osteichthyes, Mugilidae). Estuarine Coastal and Shelf Science 50, 10. • Hurst, T., Conover, D., 2002. Effects of temperature and salinity on survival of young-of-the-year Hudson River striped bass (Moronesaxatilis): implications for optimal overwintering habitats. Can J Fish AquatSci 59, 8. • Browder, J.A., Moore, D., 1981. A new approach to determining the quantitative relationship between fishery production and the flow of fresh water to estuaries, in: Cross, R., Williams, D. (Eds.), National symposium on freshwater inflow to estuaries. US Fish and Wildlife Service, Washington, D.C., pp. 403-430. • Serafy, J.E., Valle, M., Faunce, C.H., Luo, J., 2007. Species specific patterns of fish abundance and size along a subtropical mangrove shoreline: an application of the delta approach. B Mar Sci 80, 15. • CERP, 2005. Central and Southern Florida Project. Comprehensive Everglades Restoration Plan 2005 Report to Congress. U.S. Department of the Interior and U.S. Army Corps of Engineers, p. 114. • Browder, J.A., Ogden, J.C., 1999. The natural South Florida ecosystem predrainage ecology. Urban Ecosystems 3, 32. • Browder, J.A., Alleman, R., Markley, S., Ortner, P., Pitts, P.A., 2005. Biscayne Bay Conceptual Ecological Model. Wetlands 25, 15. • Marshall, F.E., Wingard, G.I., Pitts, P., 2009. A simulation of historic hydrology and salinity in Everglades National Park: coupling paleocologic assemblage data with regression models. Estuaries and Coasts 32, 16. • Serafy, J.E., Lindeman, K.C., Hopkins, T.E., Ault, J.E., 1997. Effects of freshwater canal discharge on fish assemblages in a subtropical bay: field and laboratory observations. Marine Ecology Progress Series 160, 11. • McCaughran, D.A., 1977. The quality of inferences concerning the effects of nuclear power plants on the environment, in: van Winkle, W. (Ed.), Proceedings of the conference on assessing the effects of power plant-induced mortality on fish populations. Pergamon Press, NY, p. 13. • Smith, E.P., Orvos, D.R., J., C.J., 1993. Impact assessment using the before-after-control-impact (BACI) model: concerns and comments. Can J Fish AquatSci 50, 10. • Miner, R.M., Warrick, J.W., 1974. Environmental effects of cooling systems alternatives at inland and coastal sites. Nuclear Technology 4, 10. • Talbot, J.J., 1979. A review of potential biological impacts of cooling tower salt drift. • Atmospheric Environment 13, 10. • Lin, Y.J., Fruehaur, G.L., Desai, M., 1994. An evaluation of seasonal impacts of a mechanical draft cooling tower. Bechtel Power Corporation, pp. 1098-1101. • Shrecker, G.O., WIlliams, S.L., Shofner, F.M., 1975. Atmospheric dispersion of cooling tower blow down., Environmental effects of cooling systems at nuclear power plants. . • Karr, J.R., 1981. Assessment of biotic integrity using fish communities. Fisheries 6, 6. • Nagelkerke, L.A., Van Densen, W.L.T., 2007. Serial correlation and inter-annual variability in relation to statistical power of monitoring schemes to detect trends in fish populations. Environ Monit Assess 125, 9. • Inc., E.A., 2009. Species and relative abundances of fish and shellfish in the vicinity of Turkey Point Plant based on recent collections. Ecological Associates Inc., Jensen Beach, FL, p. 27. • Council, S.A.F.M., 2009. Fishery Ecosystem Plan of the South Atlantic Region, in: www.safmc.net/ecosystem/Home/EcosystemHome/tabid/435/Default.aspx (Ed.). • Serafy, J.E., Luo, J., Valle, M., Faunce, C.H., Teare, B., D'Alessandro, E., Peyer, C., 2005. Shoreline Fish Community Visual Assessment: First Cumulative Report, Shoreline Fish Community Visual Assessment. NOAA/NMFS/SEFSC, Miami, FL, p. 49. • Company, F.P.a.L., 2011. Ten year power plant site plan: 2011-2010, in: Commission, F.P.S. (Ed.), Miami, FL. • Dolan, T.E., 2012. A case study of Turkey Point Nuclear Generating Station: Perception and Power in Environmental Assessment, Marine Affairs and Policy. University of Miami, Miami, FL, p. 183. • Faunce, C.H., Serafy, J.E., 2007. Nearshore habitat use by gray snapper (Lutjanusgriseus) and bluestriped grunt (Haemulonsciurus): environmental gradients and ontogenetic shifts. B Mar Sci 80, 17. • Luo, J., Serafy, J.E., Sponaugle, S., Teare, P.B., Kieckbusch, D., 2009. Movement of gray snapper Lutjanusgriseusamong subtropical seagrass, mangrove and coral reef habitats. Marine Ecology Progress Series 380, 14. • Harrigan, P., Zieman, J.C., Macko, S.A., 1989. The base of nutritional support for the gray snapper (Lutjanusgriseus): an evaluation based on a combined stomach content and stable isotope analysis. B Mar Sci 44, 12. • Stark II, W.E., 1970. Biology of the gray snapper, Lutjanusgriseus (Linnaeus), in the Florida Keys., in: Stark II, W.E., Schroeder, R.E. (Eds.), Investigations on the gray snapper, Lutjanusgriseus. . University of Miami Press, Coral Gables, FL, pp. 11-150. . • Brujis, M.C.M., Jenner, H.A., 2012. Cooling water system design in relation to fouling pressure, in: Rajagopal, S., Jenner, H.A., Venugopalan, V.P. (Eds.), Operational and Environmental Consequences of Large Industrial Cooling Water Systems. Dordrecht Heidelberg, London. • Pérez-Domínguez, R., Maci, S., Courrat, A., Lepage, M., Borja, A., Uriarte, A., Neto, J., Cabral, H., St. Raykov, V., Franco, A., Alvarez, M., Elliott, M., 2012. Current developments on fish-based indices to assess ecological-quality status of estuaries and lagoons. . Ecological Indicators 23, 11. • Harrison, T.D., Whitfield, A.K., 2004. A multi-metric fish index to assess the environmental condition of estuaries. J Fish Biol 65, 27. • Chen, X., Gao, H., Yao, X., Fang, H., Chen, Z., Xu, Z., 2010. Ecosystem-based assessment indices of restoration for Daya Bay near a nuclear power plant in South China. Environmental Science and Technology 44, 6. • McManus, L.C., Yurek, S., Teare, P.B., Dolan, T.E., Serafy, J.E., In Review. Goldspotted killifish (Floridichthyscarpio) habitat suitability as a measure of coastal restoration performance. Ecological Indicators. • Lirman, D., Bellmund, S., Browder, J.A., Serafy, J.E., Liehr, G.A., 2013. IBBEAM: Integrated Biscayne Bay Ecological Assessment and Monitoring. University of Miami, Biscayne National Park, National Marine Fisheries Service, p. 57. • Center, S.F.N.R., 2006. Ecological targets for western Biscayne National Park, in: Interior, D.o.t. (Ed.), Resource Evaluation Report: SFNRC Technical Series. National Park Service, Everglades National Park, p. 23. • Robles, M.D., Armentano, T., DiResta, D., Lara, M.R., Jones, D.L., Butler, M.J., 2005. Condition of the Natural Resources of Biscayne National Park. National Parks Conservation Association, Washington, DC. • Villegas, A., Schmittter-Soto, J.J., 2008. Feeding habitats of the american crocodile, crocodylusacutus (cuvier 1807) in the southern coast of Quintana Roo, Mexico. ActaZoologica Mexicana 23, 7. • Company, F.P.a.L., 2009. Site Certification Application, Turkey Point Units 6 & 7. June 2009. • Company, F.P.a.L., 2010. Turkey Point Plant, Units 6 & 7 Combined Operating License Application. Part 3: Environmental Report. Rev. 2.
Taxonomic Richness: • Variance and average richness is greatest during the wet season (Serafy et al. 2003, 2005). • In Biscayne Bay: greater at stable- vs. variable -salinity sites (Serafy et al. 1997).
Total Fish Density: • Used as an indicator of habitat productivity (Keough & Quinn 1991) • Correlated with changes in temperature and salinity (Ley et al. 1999, Lorenz 1999, Green et al. 2006, Lorenz & Serafy 2006) • Variance and average richness is greatest during the wet season (Serafy et al. 2003, 2005). • Greater temporal and spatial variability requires greater effort (Johnson 1998, Nagelkerke & van Denson 2007)
Recent Environmental Assessment Studies at TPNGS • In 2008 Ecological Associates Inc. was contracted by FPL. • 26 sampling events • Otter trawl over seagrass habitat 200m-600m from shore. • One year of pre-construction sampling. • The Essential Fish Habitat (EFH) Assessment prepared in support of the Turkey Point Expansion Project (EAI 2004), • listed 24 federally-managed species of fish that may potentially utilize habitats that occur in the vicinity of the Turkey Point Plant during some portion of their life cycle.
State and Federal Environmental Review State Federal Combined Operating License Application Atomic Energy Act of 1954 (NUREG -0980) National Environmental Policy Act of 1969 (Sec. 102 [42 U.S.C. 4332]) Environmental Assessment Finding of No Significant Impact (FONSI) or, Environmental Impact Statement • Site Certification application • Florida Electrical Power Plant Siting Act (F.S. 403.501-.518) Flowchart of the combined licensing project. Source: www.NRC.gov
Monitoring continues in this area through the Integrated Biscayne Bay Ecological Assessment and Monitoring (IBBEAM) program. • Comprehensive monitoring of mangrove-seagrass habitat, epifauna and water quality • Expansion of this effort further south would fulfill multiple needs.
<-- Location of Unit 6 & 7 <-- Location of Unit 6 & 7 • Biscayne Bay was formerly estuarine (Smith 1896, Browder & Ogden 1999, Marshall et al. 2009) • 1948 - Congress approves the Central and Southern Florida Project • 2000 – Congress approves Comprehensive Everglades Restoration Plan • Restore timing, quantity, quality and distribution of freshwater U.S. Department of Agriculture Soil Conservation Service 1938, via Pete Harlem, Florida International University
Turkey Point Nuclear Generating Station: A History • February 1973- cooling canal system begins operation • 32 unlined shallow cooling canals • 15.6 km2 of surface area • Unit 5 a natural gas unit • FPL applied for extended power uprate in 2010 U.S. Department of Commerce, 1984 U.S. Environmental Protection Agency 1974 • Degradation of benthic habitat in Card Sound (Thorhaug & Roessler 1977, Thorhaug et al. 1979)
Biscayne National Park Salinity Targets: • “Measured salinities should not exceed 30 ppt. • late dry season- early wet season : 15-25 ppt in the Western Bay Zone. • Late wet season: • the Coastal Mangrove Zone should be oligohaline (0-5 ppt) • Western Bay Zone should average less than 20 ppt. Salinity changes should be gradual (e.g. Serafy et al. 1997)