Download
1 / 1
10 likes | 145 Views
Some model details. Figure 2. Varian 2100 6 MV Complement Bar Pattern Test: PDDs (green MC; gold meas.). Comparisons of a Monte Carlo IMRT plan recalculation results with the Pinnacle treatment planning system. J Cui1 *, S Davidson2 , V Willcut1 , I El Naqa1 , D Followill2 , J Deasy1 ,

E N D
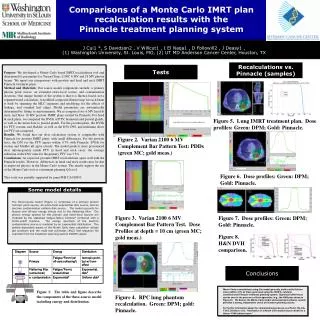
Some model details Figure 2. Varian 2100 6 MV Complement Bar Pattern Test: PDDs (green MC; gold meas.) Comparisons of a Monte Carlo IMRT plan recalculation results with the Pinnacle treatment planning system J Cui1 *, S Davidson2 , V Willcut1 , I El Naqa1 , D Followill2 , J Deasy1 , (1) Washington University, St. Louis, MO, (2) UT MD Anderson Cancer Center, Houston, TX Heading Recalculations vs. Pinnacle (samples) Purpose: We developed a Monte Carlo based IMRT recalculation tool and determined its parameters for Varian Clinac 2100C 6 MV and 18 MV photon beams. We report our comparisons with prostate and head and neck IMRT Pinnacle treatment plans. Method and Materials: Our source model components include: a primary photon point source, an extended extra-focal source, and contamination electrons. One unique feature of the system is that it is fluence-based, not a segment based calculation. A modified composite fluence map for each beam is built by summing the MLC segments and modifying for the effects of leakage, and rounded leaf edges. Model parameters are automatically determined by fitting to measurements. We re-computed two 6 MV head & neck, and three 18 MV prostate, IMRT plans created by Pinnacle. For head & neck plans, we compared the DVHs of PTV, brainstem and parotid glands, as well as the mean dose to parotid glands. For the prostate plans, the DVHs for PTV, rectum, and bladder, as well as the D50, D98, and minimum doses for PTV are compared. Results: We found that our dose calculation system is comparable with Pinnacle for prostate IMRT plans, with small differences. For the prostate tests, the D50 for the PTV agrees within 0.7% with Pinnacle. DVHs for rectum and bladder all agree closely. The model predicts more pronounced dose inhomogeneity inside PTV in head and neck cases: the average reduction in the D98 value for the primary PTV was 5.5%. Conclusions: As expected, prostate IMRT recalculations agree well with the Pinnacle results. However, differences in head and neck results may be due to improved physics in the Monte Carlo system. The results support the use of the Monte Carlo tool as a treatment planning QA tool. This work was partially supported by grant PHS CA010953. Tests Figure 5. Lung IMRT treatment plan. Dose profiles: Green: DPM; Gold: Pinnacle. Figure 6. Dose profiles: Green: DPM; Gold: Pinnacle. The three-source model (Figure 1) comprises of a primary photon isotropic point source, an extra-focal exponential disk source, and an electron contamination uniform disk source. The model accounts for fluence and off-axis energy effects due to the flattening filter. The photon energy spectra for the primary and extra-focal sources are modeled by the statistical fatigue-failure function4 combined with a Fermi-cutoff function. The energy spectrum of the electron contamination source is modeled by an exponential distribution. The patient dependent aspect of the Monte Carlo dose calculation utilizes jaw positions and the multi-leaf collimator (MLC) leaf sequence file exported from the treatment planning system DICOM output. Figure 3. Varian 2100 6 MV Complement Bar Pattern Test. Dose Profiles at depth = 10 cm (green MC; gold meas.) Figure 7. Dose profiles: Green: DPM; Gold: Pinnacle. Figure 8. H&N DVH comparison. Conclusions Monte Carlo recalculations using this model generally yield results that are close (within <2%) of those generated using the WUSTL carefully commissioned Pinnacle treatment planning system. Significant differences can be seen in the presence of heterogeneities (e.g., the H&N plan shown in Figure 8). We believe the Monte Carlo model and associated software system provides a strong, independent check of treatment planning results. For further information about the commissioning process, see Poster SU-GG-T-345, Davidson et al. “Verification of a Monte Carlo-based source model for a Varian 10 MV photon beam ” Figure 1: The table and figure describe the components of the three-source model including energy and distribution. Figure 4. RPC lung phantom recalculation. Green: DPM; gold: Pinnacle.