Download
1 / 47
470 likes | 560 Views
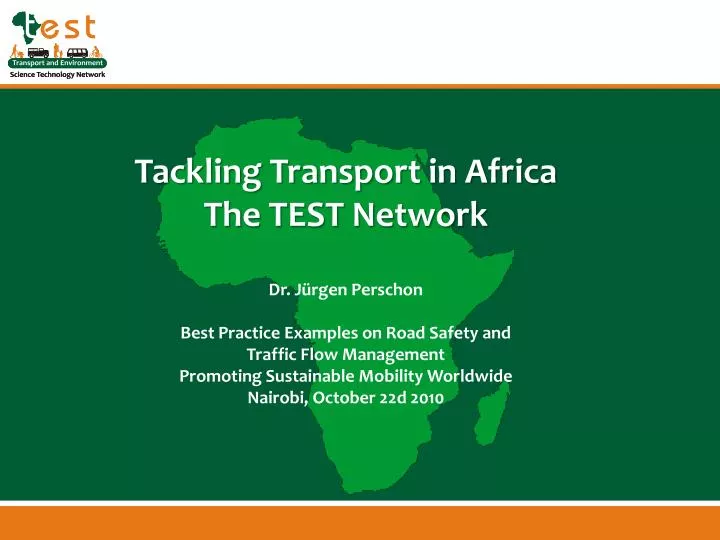
Tackling Transport in Africa The TEST Network Dr. Jürgen Perschon Best Practice Examples on Road Safety and Traffic Flow Management Promoting Sustainable Mobility Worldwide Nairobi, October 22d 2010. Five Best Practise Examples. NMT Road Safety in Eldoret / Kenya

E N D
Tackling Transport in Africa The TEST Network Dr. JürgenPerschon Best Practice Examples on Road Safety and Traffic Flow Management Promoting Sustainable Mobility Worldwide Nairobi, October 22d 2010
Five Best Practise Examples • NMT Road Safety in Eldoret / Kenya • Road Safety at intersections in Beijing / China • Traffic Demand Management in Beijing / China • Traffic Flow Management in Lagos (BRT) • International Road SafetyAssessment Program (South Africa)
The Eldoret NMT Safety Project • Between 1995 and 1999, a Program on non-motorized transport was carried out in Kenya (Nairobi, Eldoret) and Tanzania (Morogoro, Dar Es Salam) • Project was part of the Urban Mobility Component of the World Bank funded Sub-Saharan Africa Transport Policy Program (SSATP)
Background Situation before: Overtaking of slow vehicles by many fast moving motor vehicles in Eldoret endangered the safety of cyclists and pedestrians. The average speed of inbound vehicles was 48 km/hr and the maximum observed speed 82 km/hr, with outbound average speed of 51 km/hr and the maximum observed speed of 72 km/hr. The above speeds, combined with driver attitudes towards other road users and high volumes of NMT users, let to high accident rates between motorised and non-motorised vehicles Objectives: 1) Establish Pilot Projects Units within the Municipal Government 2) Establish User participation for identification of black spots) and carry out interventions to test implementation scenarios and monitor methods. The Eldoret NMT Safety Project
Measures Introduce traffic calming-measures to reduce vehicle speed Interventions to improve the supply of non motorized transport. Build special infrastructure for pedestrians and cyclists The Eldoret NMT Safety Project Roads in Eldoretpriortointerventions Roads in Eldoret after interventions
Lessons for Africa In the first place the project demonstrated that significant improvements can be made through relatively small and low cost interventions, which can be implemented in a short time (High C/B-ratio) The second main output was a significant increase in awareness amongst politicians, planners, engineers and the public of the importance of addressing the needs of non-motorized transport users. The two areas of weakness of the project were: Lack of traffic rule enforcement & related empowerment of local communities Lack of dissemination of lessons learned to other key stakeholders The Eldoret NMT Safety Project
Beijing Project of Improving Vulnerable Road Users (VRS) Safety at Intersections
Background In China, the main death and injuries at road intersections are among VRU – pedestrians, cyclists and motorcyclists. 43% of the crashes which happened at the intersections were related to VRU. Global Road Safety Partnership (GRSP) launched a 3-years project in Beijing to improve VRU safety at intersections during 2006-2008, as well as provide a good practice manual. In phase I of this project, situational study was carried out. In phase II, the chosen countermeasures were implemented and data after/before was collected and analyzed for evaluation. Main actors: Beijing Transportation Research Center of Beijing Being University of Technology Beijing Traffic Management Bureau Global Road Safety Partnership Beijing Project of Improving Vulnerable Road Users (VRS) Safety at Intersections
Measures Based on different problems of the selected 6 intersections (see map below) the following countermeasures had been implemented: Channelization/Segregation Barriers for MT Pedestrian islands Road signs Zebra- crossings Beijing Project of Improving Vulnerable Road Users (VRS) Safety at Intersections
Before and after pictures at Da Wang intersection for bus situation improvement Beijing Project of Improving Vulnerable Road Users (VRS) Safety at Intersections Impact
Before and after pictures at Dongsi Shi Tiao intersection Beijing Project of Improving Vulnerable Road Users (VRS) Safety at Intersections Impact
Xidan intersection 80% of left turn bicyclists used the waiting line The average speed of cars slightly reduced Beijing Project of Improving Vulnerable Road Users (VRS) Safety at Intersections
Beijing Project of Improving Vulnerable Road Users (VRS) Safety at Intersections Xidan Intersection: The total number of conflicts had reduced from 22 to 16, in which serious conflicts has declined from 12 to 5
Xidan intersection The number of pedestrians crossing the junction on the ground declined from 27 to 12 per hour in peak hours. Dongsi Shi Tiao intersection 89% of the pedestrians use the refuge island to cross the junction during peak hours, and 79% of them feel much safer when crossing the street In Dawang intersection With the median barriers, 95% of passengers cross the street via the zebra (35% before). 43% of passengers use the zebra when they get off the bus after painting the zebra crossing line. Beijing Project of Improving Vulnerable Road Users (VRS) Safety at Intersections
Lessons for Africa The countermeasures in this project are all normal solutions for the local communities and related actors (compare SSATP NMT Eldoret Project) Measures are neither expensive nor unique. So financial support is not the main constrain. What really matters are the multi-sector cooperation and systematic way of planning, implementation and monitoring / evaluation. Beijing Project of Improving Vulnerable Road Users (VRS) Safety at Intersections
3) Beijing Project of Traffic Demand Management during Olympic Games
Background Time period: During the 15th summer Olympic Games, August 8th to 24th 2008 Objectives Reduce the total amount of motor vehicles on the road and guarantee the roads would satisfy the demand during Beijing Olympic Games and Paralympics Games Guarantee the traffic flow of public transport for the citizens and minimize the impacts to normal citizens’ daily live Reduce the impacts of motor vehicle exhaust emissions on air quality (Main Actor: Beijing Olympic organizing committee) 3) Beijing Project of Traffic Demand Management during Olympic Games
Impact 1.8 million motor vehicles were reduced from the road The bus trips increased from 152,000 to 167,000 per day Around 350 bus lines expanded their operational hours and the average speed of buses increased to 14.5 km/h to around 20 km/h, around 30% increasing Nearly 4.5 million people shifted to public transport each day and make the passenger volume reached 21.1 million The proportion of public transport in mode share of traffic of Beijing citizens increased to 45%, 14.8% increase compared with 2006. 3) Beijing Project of Traffic Demand Management during Olympic Games
Measures From July 1st to September 20th, all high emission vehicles were banned on the road. From July 20th to September 20th, rotated the motor vehicles on road based on license plates numbers. >>> COMPARE: Bogota, Mexico, Milano a.o. <<< Specific “Olympic lanes” (exclusive access for public transport) Busses: the number increased and 34 Olympic bus lines added. Subway: improved the frequency and capacity of trains. 3) Beijing Project of Traffic Demand Management during Olympic Games
Lessons for Africa The traffic plan and supply of infrastructure should focus not only on the special event, but also on normal/daily demand of the city. For large sports or cultural events the strength of policies and the necessary supporting conditions (own committee) are essential The key role of public transport system must be considered when reducing private vehicle volumes on the road. It is worth to examine options of extending the measures to other parts of the cities and/or to adopt successful components for the post-event time 3) Beijing Project of Traffic Demand Management during Olympic Games
4) Traffic Flow Management in Lagos • Background • Amongthe 20 largestmegacities in theworld (13 Million Inh.) • Public Transportation based on smallminibuses (75000) • Nooverallpublictransportorganisation • Inner city areas road traffic is mainly unorganised, with few traffic light signaling, few bus stations and informal private businesses • High numberof private cars • Objectives • Foster economiccompetitiveness • Fightpovertythroughbetteraccessibility • Increaselifeand environmental quality • Reducetrafficcongestion/ Improvetrafficflow
4) Traffic Flow Management in Lagos • Measures • Creating a centralcoordinationandoperationorganisation (LAMATA) • Implementing a BRT-Litesystem • First corridor 22km • 65% segregatedbuslanes • Onlyforfranchisedoperators • nominibuses • Modern high-capacitybusfleet • Organisedbusstops
4) Traffic Flow Management in Lagos Johannesburg, Africa BRT, Opens August, 2009, 65,000 pax, 26 km
4) Traffic Flow Management in Lagos • Impact • Traffic flow significantly improved on BRT-Corridor • Less journey time, less waiting time • Less transfers needed, higher bus speeds • Higher efficiency: 35% less buses but same performance • Less congestion
“ It is the best thing that has happened in Lagos this year. From Palmgrove to Ojota, I used to spend one hour in the traffic jam, but now it takes me five minutes. Private Car Owner ” 4) Traffic Flow Management in Lagos Impact
Guangzhou-GangdingBRT station before/after the BRT implementation 4) Traffic Flow Management in Lagos
Lagosians, who used to take four buses in perilous conditions over 3 1/2 hours to get from Ikorodu to CMS between 4.30am and 8am, now leave Ikorodu at 6.30am, and arrive at work before 8.” BRT User “ ” 4) Traffic Flow Management in Lagos • Lessons for Africa • Success Factors: • Significant and consistent support from authorities and government • Foundation of a fully responsible transportation authority for planning and operation • Comprehensive public and institutional • participation • Opportunity missed by not implementing a • full-BRT-System ?
Lessons for Africa (continued) Historical evidence indicates that replication takes place first in the country of the successful project, even with minimal intervention. It then spreads throughout the region only with help from outside institutions, and almost not at all outside the region unless international groups push the dissemination. BRT Planning ongoing in Kampala, Nairobi, Addis Ababa and Dar Es Salam (Implementation phase) Other major cities in each of these countries therefore, are in the best position for replication with minimal outside intervention. For instance, Mombasa, Kenya’s second largest city and a major regional port, could fall into place after Nairobi 4) Traffic Flow Management in Lagos
The International Road Safety Assessment Program in South Africa Background The International Road Assessment Programme (iRAP) is dedicated to saving lives in developing countries by promoting safer road design. Africa is one of IRAPs main regions and in its work IRAP targets high-risk roads where large numbers are killed and seriously injured.
The International Road Safety Assessment Program in South Africa Objectives iRAP aims to generate and prioritise large, affordable, high-return programmes of safetyengineering countermeasures using a globally consistent methodology The organization provides the methodology and procedures to implement performance tracking so that funding agencies are able to track outcomes and outputs In the context of the TEST network it is worth to mention that IRAP provide the training, technology and reporting tools to build and sustain national, regional and local capability and shares experience and knowledge of effective road safety programmes IRAPs objective is also to design so-called “self-explaining and forgiving roads”
The International Road Safety Assessment Program in South Africa Self-explaining roads show all road users where they should be and how to use the road safely. Clear road layouts not only explain where road users are expected to be, but they also take into account the road user’s ability to process information and make decisions. An inexpensive, simple pedestrian refuge island not only shows where to cross but makes safe crossing much easier – the pedestrian has to check only one stream of oncoming traffic at a time. Forgiving roads are designed to protect road users in the event of a crash. The design of the road must recognize that crashes can occur and ensure that fatalities and injuries are minimised by protecting road users from hazards. Engineering features, such as safety barriers can be used to separate fast moving traffic from people and cushion crasheswhen they happen. (Source: Vaccines for Roads – The IRAP Tools and their pilot application. Hampshire, UK,2008)
The International Road Safety Assessment Program in South Africa Measures Network safety management • Collection of reliable crash data. iRAP Risk Mapping can be produced using these data in order to show where people and communities face high levels of risk. • Road authorities must have information about the level of safety and traffic flow on their network. Star Rating inspections document this road attribute information and more detailed road safety audits can be used to identify specific sites and problems. • As safety treatments are used, the outcomes must be measured, analysed and recorded so that lessons can be learnt about the impact of different schemes. The evidence base should direct future action, ensuring that the most efficient life-saving measures are implemented.
The International Road Safety Assessment Program in South Africa • Risk Mapping and Performance Tracking • Where complete, accurate, and plentiful data are available, two RAP protocols that use real crash data can provide clear information on risk and can guide infrastructure improvements. • Risk Mapping: Maps are produced using crash history data, showing the risk of being killed or seriously injured. • Performance Tracking: RAP enables tracking of the rate at which high-risk roads are eliminated. Performance tracking identifies ‘consistently high-risk roads’ where authorities need to do more and the ‘most improved roads’ to highlight good practice and encourage competition in excellence.
The International Road Safety Assessment Program in South Africa Star Rating roads for safety The IRAP Star Rating of roads provides a methodology to measure the safety performance of a road network. This is particularly valuable where crash data records are unavailable, inaccurate or sparse. Inspectors record over 30 road attributes known to influence the likelihood and severity outcome of road crashes. The road attributes are scored and combined to reflect the overall safety of the road for car occupants, motorcyclists, cyclists and pedestrians. Scores are then assigned 1-5 stars, allowing cartographic presentation. In South Africa inspections were done on 2100 km of roads in KwaZulu-Natal, approximately 4% of South Africa’s paved roads. The examples below show urban and rural roads that would achieve a low Star Rating (black and red) and a high Star Rating (yellow and green)
The International Road Safety Assessment Program in South Africa
The International Road Safety Assessment Program in South Africa • Star Rating results • The Star Ratings represent the safety of the road infrastructure as it relates to the risk faced by an individual member of each road user group (Car Occupants, Motorcyclists, Bicyclists and Pedestrians). • A 5-star rating represents the safest road infrastructure design for the prevailing speed environment • A 1-star rating represents a road with • relatively poor infrastructure design for • the prevailing speed environment Star Rating results by road user for South Africa
The International Road Safety Assessment Program in South Africa Impact Casualty savings The iRAP pilot studies have been applied on a sample of roads in a number of countries, with significant casualty reductions expected following the implementation of the recommended programmes. In South Africa the recommended countermeasure programme is estimated to save 6,900 lives and serious injuries over the next 20 years. This represents a 12% reduction in the casualties on the roads surveyed. On average, each life and serious injury would cost US$ 7,600 to save and overall the investment benefits are estimated to be worth US$ 0.6 billion.
The International Road Safety Assessment Program in South Africa Lessons for Africa The iRAP inspection methodology has been successfully applied in some African countries (among Uganda and South Africa). The Star Rating of roads for each of four different user groups – car occupants, motorcyclists, bicyclists and pedestrians – was successful. When the iRAP team and local African engineers come together after the inspections have been completed it becomes critical to develop appropriate countermeasure programmes. The pilot results were convincing in this respect and pilot countries like South Africa are already beginning to plan to implement recommendations. The recommended programmes in each of the pilot programmes not only have the potential to save many lives and serious injuries, but also offer attractive investment returns: The overall Benefit-Cost Ratio for the recommended programmes is 12 in South Africa