Download
1 / 18
190 likes | 370 Views
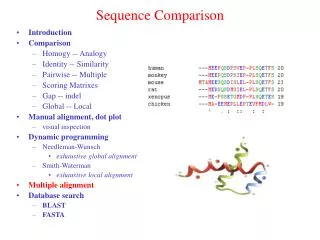
Improved tools for biological sequence comparison. Author : WILLIAM R. PEARSON, DAVID J. LIPMAN Publisher: Proc. Natl. Acad. Sci. USA 1988 Presenter: Hsin-Mao Chen Date: 2010/04/28. Outline. Introduction Step 1 Step 2 Step 3 Step 4 Result. Introduction. A heuristic method.

E N D
Improved tools for biological sequence comparison Author: WILLIAM R. PEARSON, DAVID J. LIPMAN Publisher: Proc. Natl. Acad. Sci. USA 1988 Presenter: Hsin-Mao Chen Date:2010/04/28
Outline • Introduction • Step 1 • Step 2 • Step 3 • Step 4 • Result
Introduction • A heuristic method. • The FASTA program is a more sensitive derivative of the FASTP program[1985].
Introduction SW FASTA
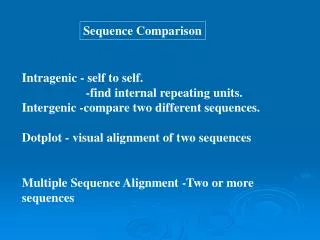
Step 1 • By using a lookup table to locate all identities between two DNA or amino acid sequences. • Dot matrix • Lookup table
Step 1 Dot matrix
Step 1 Lookup table 5 10 15 20 A: TCGGA TTCGT ACGGT ACGGA TC B: GTAAA CCACA ktup (k-tuple)=2
Step 1 Lookup table 5 10 15 20 A: TCGGA TTCGTACGGT ACGGA TC B: GTAAA CCACA ktup (k-tuple)=2
Step 1 Lookup table 5 10 15 20 A: TCGGA TTCGT ACGGTACGGA TC B: GTAAA CCACA ktup (k-tuple)=2
Step 2 • Rescore these 10 regions using a scoring matrix (PAM250、Blosum50 ) and save the best initial regions greater than threshold.
Step 2 PAM250
Step 3 • FASTA calculates an optimal alignment of initial regions as a combination of compatible regions with maximal score.
Step 4 • This final comparison considers all possible alignments of the query and library sequence that fall within a band centered around the highest scoring initial region.
Result Ktup=4 IBM PCAT microcomputer Completed in under 15 min