Download

1 / 24
280 likes | 981 Views
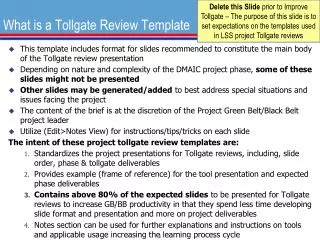
What is a Tollgate Review Template. Delete this Slide prior to Analyze Tollgate – The purpose of this slide is to set expectations on the templates used in LSS project tollgate reviews.

E N D
What is a Tollgate Review Template Delete this Slide prior to Analyze Tollgate – The purpose of this slide is to set expectations on the templates used in LSS project tollgate reviews • This template includes format for slides recommended to constitute the main body of the Tollgate review presentation • Depending on nature and complexity of the DMAIC project phase, some of these slides might not be presented • Other slides may be generated/added to best address special situations and issues facing the project • The content of the brief is at the discretion of the Project Green Belt/Black Belt project leader • Utilize (Edit>Notes View) for instructions/tips/tricks on each slide The intent of these project tollgate review templates are: • Standardizes the project presentations for Tollgate reviews, including, slide order, phase & tollgate deliverables • Provides example (frame of reference) for the tool presentation and expected phase deliverables • Contains above 80% of the expected slides to be presented for Tollgate reviews to increase GB/BB productivity in that they spend less time developing slide format and presentation and more on project deliverables • Notes section can be used for further explanations and instructions on tools and applicable usage increasing the learning process cycle
Lean Six Sigma<Project Title> <Green Belt/Black Belt Name> Project Initiation Date: <DD/MM/YY> Analyze Tollgate Date: <DD/MM/YY>
Lean Six Sigma: AnalyzeImprovement Process Road Map Identify and Implement Quick Improvements with R.I.E R.I.E, 5S, NVA Analysis, Generic Pull Systems, Four Step Rapid Setup Method Define Measure Analyze Improve Control Activities Tools • Identify Potential Root Causes • Reduce List of Potential Root Causes • Confirm Root Cause to Output Relationship • Estimate Impact of Root Causes on Key Outputs • Prioritize Root Causes • Complete Analyze Tollgate • Process Constraint ID and Takt Time Analysis • Cause & Effect Analysis • FMEA • Hypothesis Tests/Conf. Intervals • Simple & Multiple Regression • ANOVA • Components of Variation • Conquering Product and Process Complexity • Queuing Theory Update any activities or tools used in the Analyze Phase of your project – You use this slide to outline Analyze phase activities and tools used – delete this note before tollgate
Project Charter Delete this Note prior to Analyze Tollgate – Update Charter Problem/Goal Statement Business Impact Problem: Describe problem in plain English using non-technical terms • Statement should explain why project is important; why working on it is a priority Scope: Goal: Goals should communicate “before” and “after” conditions • Shift mean, variance, or both? • Should impact cost, time, quality dimensions • Express goals using SMART criteria • Specific, Measurable, Attainable, Resource Requirements, Time Boundaries • Explain leverage and strategic implications (if any) • State financial impact of project • Expenses • Investments (inventory, capital, accounts receivable ) • Revenues • Separate “hard” from “soft” dollars (Cost Reduction, Revenue Generation, Non-Quantifiable Benefits) • State financial impact of leverage opportunities (future projects) • Update the file “Financial Benefits in the financial template” Core Team Tollgate Review Schedule TollgateScheduledRevisedComplete Define: 01/18/07 - XX/XX/09 Measure: 02/14/07 XX/XX/07 XX/XX/09 Analyze: 02/28/07 XX/XX/07 XX/XX/09 Improve: 03/22/07 XX/XX/07 XX/XX/09 Control: 04/16/07 XX/XX/07 XX/XX/09 • PES Name Project Executive Sponsor (if different from PS) • PS Name Project Sponsor/Process Owner • GB/BB Name Green Belt or Black Belt Project Leader • MBB Name Master Black Belt Core Team Role % Contrib. LSS Training • Team Member 1 SME XX AT (Awareness Training) • Team Member 2 TM XX GB • Team Member 3 SME XX PS (Project Sponsor) • Team Member 4 SME XX AT Training Scheduled Extended Team • Team Member 1 Finance XX Not Trained • Team Member 2 IT XX Not Trained • Review high-level schedule milestones here: • Phase Completions • Tollgate Reviews • Trials
Measure Overview Delete this Note prior to Analyze Tollgate – Update Measure Overview (D) = Discrete (C) = Continuous Process Capability Graphical Analysis • CCR: ? • Unit (d) or Mean (c): ? • Defect (d) or St. Dev. (c): ? • DPMO (d): ? • Sigma (Short Term): ? • Sigma (Long Term):? • MSA Results: show the percentage result of the GR&R, AR&R or other measurement systems analysis carried out in the project Root Cause / Quick Win Tools Used • Root cause: • Quick Win #1 • Root cause: • Quick Win #2 • Root cause: • Quick Win #3 • Time Series Plot • Probability Plot • Pareto Analysis • Operational Definitions • 5s • Generic Pull • Control Charts • Detailed process mapping • Measurement Systems Analysis • Value Stream Mapping • Data Collection Planning • Basic Statistics • Process Capability • Histograms
Baseline Basic Statistics Delete this Note prior to Analyze Tollgate – Normality or Graphical Summary slide to denote the shape and normality of your baseline data • The current process has a non-normal distribution with the P-Value < 0.05 but does have a normal bell-shape. • Since the mean and median are the same in days (29) +/- 0.5 days, we will not transform data. • The range is 35 and the standard deviation is 2.7 days
Process Constraint ID and Takt Time Analysis Delete this Note prior to Analyze Tollgate – Time Trap Identification – the process (or process step) that injects the most amount of delay into the process is the time trap. • Takt Rate Analysis compares the task time of each process (or process step) to: • Each other to determine the time trap • Customer demand to determine if the time trap is the constraint Net Process Time Available Number of Units to Process Number of Units to Process Net Process Time Available Takt Time = Takt Rate = Customer Demand Rate =
Cause & Effect Diagram Facilities & Equipment Materials Manpower Wrong Location High Maintenance Space 1 No Standardization of seats Old Buildings Lack of Seats Lack of Knowledge Inequality in seats Ugly New Codes Lack of Funds Lack of Controls Not Suited for Current Mission “Dedicated” to Task Senior Leader 3 ATFP (Type of Space) No Suitable space to Assign Getting Seats Takes Time No Prioritization Fragmented % Utilization of space on base Master Plan Collateral Duties Low Priority Effect: Too Long to develop space options MILCON CPP Minor Construction Vague Reqmts Lease Lack of Database Unplanned Programs People Credible Requirement Facilities Multiple Paths Location Costs (Lack of Funding) V-22 NCW (Competing for Same Space) Postal NAWC Too Many Space Brds (NVA) Lack of Controls NAWC Rates Budgeting (Time) Senior Leadership Over Processing PMA Burden No Cost to seat user Inconsistent Msg “Numbers coming Down” Too Long (Time) Delays in elevating Impasse issues 2 Collocation Mold, HVAC Crashes Approvals Mother Nature Unforeseen Circumstances Methods Measurements CAO/IPT Time Avail to Wait Funding Decision Details Competency vs. PMA Comp vs. Comp Delete this Note prior to Analyze Tollgate – Update with your teams Cause & Effect Diagram – Circling key root causes
Control/Impact Matrix • Too many space boards • Lack of seat control • “dedicated staff” • Lack of Knowledge- limited trained staff • Inconsistency of seat usage (some • double desking and some removing seats) • Delays in elevating impasse issues • Collocation Issues • Competing Requirements (Location) • Lack of a Database • Low priority issues • Standardization of seats • Senior Leader in charge • Master Plan for Space • Master Priority • PMA versus Competency • Credibility of the Requirement Delete this Note prior to Analyze Tollgate and insert the team’s assessment – What causes (X’s) have the highest impact and are within team’s control? • Lack of Seats • % Utilization on base • Unplanned programs • Funding decisions taking too long • Quality of buildings • New Codes • Lack of funding • PMA or NAWC Burdens • Budgeting Time Required • Cost to seat user
FMEA Delete this Note prior to Analyze Tollgate – Failure Modes and Effects Analysis (FMEA) draft the currently identified risks (Severity, Occurrence, and Detection). Additional fields can be added (if needed) such as the Target/Actual completion dates of actions recommended. • Risk Analysis recommended actions (Key Speaking Points) • Rating Index • Total Current RPN Risk
C&E Matrix Delete this Note prior to Analyze Tollgate – Use Cause and Effect Matrix to prioritize Y’s, Process Steps, and X’s
Pareto Plot Delete this Note prior to Analyze Tollgate – Pareto Plots to show Defect Types or Defects by a Measure subgroup The South and North contain over 80% of the Defects. Our project will focus here and not on the East and West.
Linear Regression Delete this Note prior to Analyze Tollgate – (Optional Tool) Used to explain the variation between Y & X • 95% confident that 94.1% of the variation in “Wait Time” is from the “Qty of Deliveries”
One Way ANOVA Delete this Note prior to Analyze Tollgate – This type of analysis is for 1 Continuous Y and 2 or more Discrete X’s to test for differences in means. Boxplot: Part/ No Part Impact on Ticket Cycle Time • After further investigation, possible reasons proposed by the team are OEM backorders, lack of technician certifications and the distance from the OEM to the client site. It is also caused by the need for technicians to make a second visit to the end user to complete the part replacement. Next step will be for the team to confirm these suspected root causes. Analysis of Variance for Net Hour Source DF SS MS F P Part/No 1 7421 7421 8.65 0.004 Error 69 59194 858 Total 70 66615 Individual 95% CI's For Mean Level N Mean StDev --+---------+---------+---------+---- No Part 27 21.99 19.95 (--------*---------) Part 44 43.05 33.70 (------*------) --+---------+---------+---------+---- Pooled StDev = 29.29 12 24 36 48 • Because the p-value <= 0.05, we can be confident that calls requiring parts do have an impact on the ticket cycle time.
Hypothesis Test Summary Delete this Note prior to Analyze Tollgate – Double-click to open form for edit, summaries test, p-values and factors tested with your observations/conclusions
Quick Wins (Update) Delete this Note prior to Analyze Tollgate – Update with a description of Quick Wins targeted or completed for your project • 5s • 4-Step Setup Reduction • Inventory Reduction • MSA Improvements • Price reductions • Reduced TIMWOOD (Non-value added steps or work) • Generic Pull System • RIE events • Other
Business Impact Delete this note once slide edits are complete – Update Projected Project Benefits (Include calculations) • State financial impact of project • Expenses • Investments (inventory, capital, A/R) • Revenues • Separate “hard” from “soft” dollars • State financial impact of future project leverage opportunities • Update the file “Financial Benefits in Your Financial Work Book”
Current Status Delete this Note prior to Analyze Tollgate – Update Current Status • Key actions completed • Lean Six Sigma Tools used • Lessons learned • Communications, team building, organizational activities
Barriers/Issues Delete this Note prior to Analyze Tollgate – Update Issues/Barriers from the Issues Log • Resources • Unexpected delays • Team issues • Organization issues • Other
Next Steps Delete this Note prior to Analyze Tollgate – Update Next Steps Planned • Key actions • Planned Lean Six Sigma Tool use • Questions to answer • Barrier/risk mitigation activities
Backup Slides have been added to assist the project team in supplemental material supporting the project. Note: Project template slides form a structure for approximately 80% Tollgate review expectations. See your MBB/DD for feedback on changing template, removing/adding any slides for your Tollgate review. Backup slides are not required for Tollgate reviews and those posted are for the teams' review. Additionally, DD and Sponsors might have specific questions they expect to be answered that have not been included in this template, relating specifically to your project needs. Please delete this note prior to Tollgate review as well as any notes on the template slides that have been added to help the team better understand the tool usage. Backup Slides
Analyze Tollgate Checklist Stop Tollgate Review Has the team identified the key factors (critical X’s) that have the biggest impact on process performance? Have they validated the root causes? • Has the team examined the process and identified potential bottlenecks, disconnects, and redundancies that could contribute to the problem statement? • Has the team analyzed data about the process and its performance to help stratify the problem, understand reasons for variation in the process, and generate hypothesis as to the root causes of the current process performance? • Has an evaluation been done to determine whether the problem can be solved without a fundamental ‘white paper’ recreation of the process? Has the decision been confirmed with the Project Sponsor? • Has the team investigated and validated (or devalidated) the root cause hypotheses generated earlier, to gain confidence that the “vital few” root causes have been uncovered? • Does the team understand why the problem (the Quality, Cycle Time, or Cost Efficiency issue identified in the Problem Statement) is being seen? • Has the team been able to identify any additional ‘Quick Wins’? • Have ‘learnings’ to-date required modification of the Project Charter? If so, have these changes been approved by the Project Sponsor and the Key Stakeholders? • Have any new risks to project success been identified, added to the Risk Mitigation Plan, and a mitigation strategy put in place? Deliverables: • List of Potential Root causes • Prioritized List of Validated Root Causes • Additional “Quick Wins”, if applicable • Refined Charter, as necessary • Updated Risk Mitigation Plan Green Belt/Black Belt Actions: • Deliverables Uploaded in Your Financial Work Book • Deliverables Inserted into the Project “Notebook” (see Deployment Director)
Sign Off Enter Name Here Green Belt/Black Belt Enter Name Here Sponsor / Process Owner Enter Name Here Finance Representative Enter Name Here Champion Enter Name Here Master Black Belt Delete this Note prior to Analyze Tollgate – Update Project Signoff that project is closed and transition to Process Owner is complete • I Concur that the Analyze phase was successfully completed on XX/XX/06 • I concur the project is ready to proceed to next phase: Improve