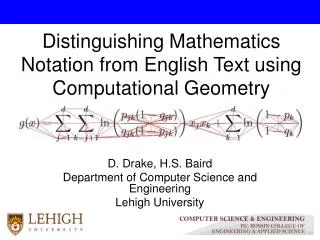
Distinguishing Mathematics Notation from English Text using Computational Geometry
160 likes | 377 Views
Distinguishing Mathematics Notation from English Text using Computational Geometry. D. Drake, H.S. Baird Department of Computer Science and Engineering Lehigh University. The Task. Differentiate isolated math and English textlines. English text or Math?. English text or Math ?.

Distinguishing Mathematics Notation from English Text using Computational Geometry
E N D
Presentation Transcript
Distinguishing Mathematics Notation from English Text using Computational Geometry D. Drake, H.S. Baird Department of Computer Science and Engineering Lehigh University
The Task Differentiate isolated math and English textlines English text or Math? English text or Math? How can Optical Character Recognition (OCR) systems make this distinction? (a) math symbols; (b) spatial arrangement
Applications of Textline Classification Commercial OCR systems: far better on text than on math • e.g. OCR systems still garble math Textline classification allows: • Processing of text/math differently • Hand off math to special purpose recognizers • Users can see Math textlines as image • No OCR errors
Prior Work Past approaches: Symbol recognition plus spatial analysis Our approach: Purely spatial analysis
Voronoi Diagrams Given a set of point sites in the plane, Partition the plane into regions such that the points in each region are closer to one site than any other A computational geometry data structure which is invariant under arbitrary nonsingular similarity transformations (translation, rotation, & scaling) --- and is efficiently computable
We use Kise’s Area Voronoi diagrams Input Image Sample points on boundary of black connected components Compute Voronoi Diagram Compute Area Voronoi Diagram Compute Neighbor Graph Input to our classifier – decides whether textline is math or text
Features of the Neighbor Graph we use for Classification 90° 45° Up Right Left 0° Down Crafted to detect spatial arrangements among characters that distinguish math from text Node Features • aspect ratio • diameter/area ratio • ‘fanout’: Edge Features • angle (wrt horizontal) • ratio of areas • ratio of diameters • ‘shadowing’: ] + Coarsely quantized Binary-valued: presence (1) or absence (0)
Classifier design • 77 node binary features • 2926 quadratic binary features (ANDing pairs of features) • assume class-conditional independence among quadratic features • trained a Bayesian node classifier • 29 edge binary features • 406 quadratic binary features (pairs of features) • assume class-conditional independence among quadratic features • trained a Bayesian edge classifier • Combined results into a textline classifier • Runs fast: 0.072 CPU sec per textline on average (on a 650 MHz SunBlade); not optimized for speed
Training & Test data • Collected 264 images of textlines: • from scanned math books • also, synthesized using LaTeX • Training set: • 132 textlines: 68 math, 64 text • 7273 nodes total: 2273 math, 5000 text • 9358 edges total: 3827 math, 5531 text • Test set: • 132 textlines: 68 math, 64 text • 7072 nodes total: 2269 math, 4803 text • 9322 edges total: 4005 math, 5317 text (A small, preliminary trial….)
Results Experiment performed on synthetically-generated images and scanned books Confusion Matrix Error Rates Examples of misclassified textlines:
Summary • Analysis of spatial arrangements (without symbol recognition) handles many cases • Automatically trainable • Needs no prior knowledge of font, font size, or spacing • Far less effort to train spatial classifiers than to build a recognizer for math symbols in all typefaces, sizes, etc • Possibly easily extendable to (trainable on) other languages than English
Future Work • Locate inline math • Mop up failure cases by adding a few more simple spatial features • Speed up (if desirable) by pruning features
Acknowledgements Koichi Kise, Osaka Prefecture University for generously contributed advice and code --------------------------------------------------------------- Derek Drake who, after all, did all the work who by rights should be giving this talk … but he’s starting the CS PhD program at Purdue Univ. this week