Download

1 / 13
130 likes | 199 Views
American Community Survey Multi-Year Estimates. Pennsylvania Data Users’ Perspectives. Multi-Year Estimates. Background Geographic Matters Availability Shortcuts Table Availability Comparability Accuracy and Margins of Error. Background.

E N D
American Community Survey Multi-Year Estimates Pennsylvania Data Users’ Perspectives
Multi-Year Estimates • Background • Geographic Matters • Availability • Shortcuts • Table Availability • Comparability • Accuracy and Margins of Error
Background • The Pennsylvania State Data Center answers several thousand data requests per year. • An extremely wide range of expertise: from clients without a computer to professional data analysts. • Clients come from many constituencies. • State Legislators, State Government, Media, Planners, Non-Profits, Educators (and many more).
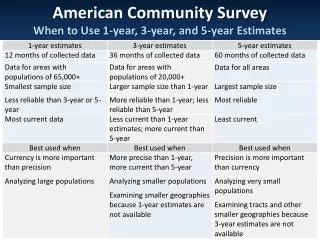
Geographic Matters • The advent of 3-Year Multi-Year Estimates has been a boon to many data users across the commonwealth. • 61 of Pennsylvania’s 67 counties are covered by ACS 3-Year Estimates. • Those missing counties are the single biggest obstacle to many data users. • i.e., I need data for all counties.
Geographic Shortcuts • Other Geographies can stand in for groups of counties to complete county coverage. • MSAs • PUMAs and Super-PUMAs. • Data Users need to be warned not to subtract missing counties from MSAs or PUMAs in an attempt to ‘back out’ the missing geographies. • Other geographies can offer complete state coverage: • Congressional Districts
Geography • 3-year Estimates cannot supplant the (eventual) geographic coverage of 5-year estimates. • Often, the answer must be “wait until 2010.”
Table Availability • Increased Table Availability is one of the most popular benefits of Multi-Year Estimates. • Data Users have been surprised and annoyed by the dynamic filtering of tables. • Moving from 1-Year Estimates to 3-Year Estimates has helped these data users include tables at risk of being filtered.
Table Availability • The lack of a Advanced Query-like system for ACS has greatly restricted clients with very specific data needs. • PaSDC has begun using ACS Multi-Year PUMS for more complex and specific requests. • Unfortunately, a much more time-consuming and laborious effort than using Detailed Tables. • At the expense of much geographic detail.
Comparability • Data users are unsure of how ACS data can be compared to Census 2000 data. • The ACS web site is a useful resource. • More detailed guidance is still lacking. • What to do with ‘Compare with Caution’? • Especially when comparatively benign comparisons (e.g., Age) and more worrisome comparisons (e.g., Income/Poverty) are both ‘Compare with Caution.’
Accuracy and Margins of Error • By far, the most common complaints from data users regard the margins of error. • How do we determine reliability? (i.e., What do they mean?) • How do we display them? (Can’t always double the number of columns in a publication.) • How to derive new ones for manipulated tables? (Most data users balk at the first sight of a square root sign!)
Accuracy and Margins of Error • Unfortunately, the most common reaction and use of margins of error (among data users) is to ignore them completely and delete them from published tables. • More tools are needed to make ACS margins easier and more accessible to work with. (More collapsed tables!)
Best Advice for ACS Data Users • Choosing tables and picking geographies is much more important (and difficult!) with ACS data than with Census 2000. • Principle: the more detailed data you need, the higher level of geography you should expect. • Corollary: the smaller geography you need, the simpler table you should expect to use.
Kevin McCullough Senior Research Coordinator Pennsylvania State Data Center kwm10@psu.edu 717-772-2710