Exercise Accessibility Disparity in Los Angeles Communities
170 likes | 264 Views
This project evaluates the accessibility of physical fitness options in different Los Angeles communities. Through spatial analysis and mapping techniques, it compares high-income areas like Malibu and Pacific Palisades with low/moderate-income neighborhoods such as Compton and Watts, examining factors like road networks, parks availability, and gym distribution.

Exercise Accessibility Disparity in Los Angeles Communities
E N D
Presentation Transcript
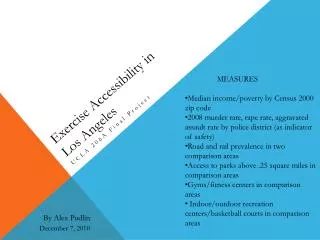
Exercise Accessibility in Los Angeles • MEASURES • Median income/poverty by Census 2000 zip code • 2008 murder rate, rape rate, aggravated assault rate by police district (as indicator of safety) • Road and rail prevalence in two comparison areas • Access to parks above .25 square miles in comparison areas • Gyms/fitness centers in comparison areas • Indoor/outdoor recreation centers/basketball courts in comparison areas UCLA 206A Final Project By Alex Pudlin December 7, 2010
Exercise Accessibility in Los Angeles MAIN QUESTION • Are physical fitness options equally accessible for different communities in Los Angeles? • Comparison Areas • A group of high income communities (Malibu, Pacific Palisades, Brentwood, Agoura Hills) • A group of low/moderate income communities (Compton, Watts)
Maps by Alex Pudlin Skills demonstrated: Inset map, boundary subset selection (LA Area was derived by selecting cities within three miles of Los Angeles City)
Road and Rail Networks in Comparison Areas Malibu, Pacific Palisades, Agoura Hills Maps by Alex Pudlin SKILLS DEMONSTRATED: Attribute sub-sets (the following variables were derived from selecting attributes based on road type: interstates, freeways, major arterials), slide with 7+ layers
Maps by Alex Pudlin * *With adequate 2000 Census data Skills demonstrated: buffer zones, chart, centroid calculation. Parks above .25 square miles was derived by selecting parks with an area above .25 square miles from all parks within LA Area
Maps by Alex Pudlin SKILLS DEMONSTRATED: Aggregating Attribute Fields (Crime rate determined by ((2008 Part I CRIME/2008 District Population Estimate)*100,000))
Map by Alex Pudlin SKILLS DEMONSTRATED: Spatial analyst raster calculator (Index = Reclassified Homicide Rate + Reclassified Rape Rate + Reclassified Aggravated Assault Rate)
Gyms and Fitness Centers in Comparison Areas Maps by Alex Pudlin Malibu, Pacific Palisades, Agoura Hills Compton, Watts Maps by Alex Pudlin SKILLS DEMONSTRATED: Geocoding, charts, aggregating attribute fields (population density derived by dividing Census Tract population by Census Tract area)
Recreation Centers and Parks with Basketball Courts in Comparison Areas Compton, Watts Malibu, Pacific Palisades, Agoura Hills Maps by Alex Pudlin Maps by Alex Pudlin
Map by Alex Pudlin Maps by Alex Pudlin Maps by Alex Pudlin Maps by Alex Pudlin SKILLS DEMONSTRATED: Hot Zone Analysis, Spatial Analyst Raster Calculator. Index = (([reclassrec]) - (1 / [reclassppl2])* 2.5)
Map by Alex Pudlin Maps by Alex Pudlin Maps by Alex Pudlin SKILLS DEMONSTRATED: Hot Zone Analysis, Spatial Analyst Raster Calculator. Index = ([reclassreccenter2]) - (1 / [reclassppl2]*2.5)
Maps by Alex Pudlin Final Index Inputs Parks raster based on Euclidian distance from park>.25 sq. mi. centroid to zip code centroids
Map by Alex Pudlin Map by Alex Pudlin Index = [recincfinal] + [carindex] + ([reclcrimfin] * 2.5) + ([parkindex] * 2) + ([GYM INDEX] * 3) + ([REC INDEX] * 2)
Exercise Accessibility in Los Angeles CONCLUSION • Are physical fitness options equally accessible for different communities in Los Angeles? • Based on index results, I conclude that exercise is indeed less accessible for residents of Compton/Watts than for residents of Malibu/Pacific Palisades/Agoura Hills
Model for “Parks Over .25 Square Mile” Shapefile and Metadata for “Gyms in Comparison Areas” Shapefile