Download

1 / 18
180 likes | 211 Views
The Environmental Sustainability Index (ESI) benchmarks national environmental stewardship by evaluating 76 variables across 21 indicators and 5 components. Analysis includes air and water quality, biodiversity, ecosystem stress, waste management, human vulnerability, governance, energy efficiency, social capacity, and more. This framework provides insights for policy development and global stewardship efforts.

E N D
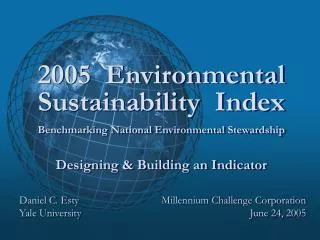
2005 Environmental Sustainability Index Benchmarking National Environmental Stewardship Millennium Challenge Corporation June 24, 2005 Designing & Building an Indicator Daniel C. Esty Yale University
Constructing the ESI 76 variables 21 indicators equally weighted average 5 components ESI Score
76 Variables 21 Indicators 5 Components • Nitrogen dioxide concentration • Sulfur dioxide concentration • Particulate concentration • Indoor air quality Air Quality • Ecoregions at risk • Threatened birds • Threatened mammals • Threatened amphibians • National Biodiversity Index Biodiversity Environmental Systems Land • Wilderness area • Developed area • Dissolved oxygen • Electrical conductivity • Suspended solids • Phosphorus concentration Water Quality Water Quantity • Surface water availability • Groundwater availability • Coal consumption • Nitrogen oxide emissions • Sulfur dioxide emissions • VOC emissions • Vehicles in use Reducing Air Pollution Reducing Ecosystem Stress • Forest cover change • Acidification Reducing Population Pressure • Population growth • Total fertility rate Reducing Stresses Reducing Waste & Consumption Pressures • Hazardous waste generation • Ecological Footprint • Waste recycling rates • Industrial organic effluents • Fertilizer consumption • Pesticide consumption • Area under water stress Reducing Water Stress • Overfishing • Sustainably managed forests • Market distortions • Salinization due to irrigation • Agricultural subsidies Natural Resources Management • Deaths from intestinal infect. diseases • Child mortality rate • Child mortality due to respiratory infections Environmental Health Reducing Human Vulnerability Basic Human Sustenance • Malnutrition • Safe drinking water supply • Casualties due to environmental disasters • Environmental Hazard Exposure Index Exposure to Natural Disasters • Gasoline price • Corruption • Government effectiveness • Protected land area • Environmental governance • Strength of rule of law • Civil and political liberties • Sustainable development data gaps • International environmental engagement • Environmental knowledge creation • Democratic institutions • Local Agenda 21 initiatives Environmental Governance Social and Institutional Capacity Energy Efficiency • Energy efficiency • Renewable energy production • Corporate sustainability (Dow Jones) • Corporate sustainability (Innovest) • ISO 14001 certified companies • Private sector environmental innovation • Participation in Responsible Care Program Private Sector Responsiveness • University enrollment • Research scientists • Innovation capacity • Digital Access Index • Female primary education Science and Technology • Intergovernmental environmental activities • Role in intl. environmental aid • Participation in intl. environmental agreements Participation in International Collaborative Efforts Global Stewardship Greenhouse Gas Emissions • Greenhouse gas emissions / GDP • Greenhouse gas emissions / capita • Transboundary sulfur dioxide spillovers • Polluting-goods imports Reducing Transboundary Environmental Pressures
Indicator Construction Indicator Component Variables • NO2 concentration • SO2 concentration • Particulate concentration • Indoor air quality Environmental Systems Air Quality
ESI Rankings Top Ten Bottom Ten Other Countries
Peer groups Multiple perspectives income-based geographic political / trade groupings statistically derived Key to Policy Leverage
Bottom Quintile 4th Quintile 3rd Quintile 2nd Quintile Top Quintile ESI Country Scores by Quintile
Cluster Analysis: ESI Characteristic-Based Country Groupings
Better policy management Improved performance and results Benchmarking – shows what is possible Competitiveness pressure leaders and laggards best practices Why Measure?
Supports merit-based aid Helps clarify what is “meritorious” Makes decisionmaking more objective Application in MCC Context
No purely “objective” criteria Data limitations are significant Measurement challenges should not be an excuse to withhold aid But note:
Elements of effective and credible index • Theoretical foundation • Openness about strengths and weaknesses • Transparent methodology • Published data • Crosscheck – peer review • Sensitivity analysis (JRC)
Environment is a hard topic to capture multidimensional issue divergent priorities and values Companies invest in measurement so should MCC A sound analytic framework cannot be developed on the cheap MCC Issues to Consider
What to Measure? • Choices • Outcomes • Inputs (efforts) • Processes • Trends • Targets • Absolute • Relative • How to fill data gaps
MCC Evaluation of Options • Seek a credible capacity to deliver • Emphasize an operational set of indicators • Stress experience and a proven track record • Look for a clear action blueprint • What issues to track • Where data will come from • How to check/verify data • Strategy for revising and updating
Sensitivity Analysis • Checks the robustness of the rankings • Evaluates sensitivity to the assumptions and aggregation methods utilized
The 2005 ESI is available at: www.yale.edu/esi