Multi-dimensional Data Visualization using Star Coordinates
220 likes | 258 Views
Explore how Star Coordinates simplify complex data representations to unveil clusters, trends, and outliers in multi-dimensional datasets. Discover interaction techniques, evaluation methods, and the power of dynamic visualization in knowledge discovery.

Multi-dimensional Data Visualization using Star Coordinates
E N D
Presentation Transcript
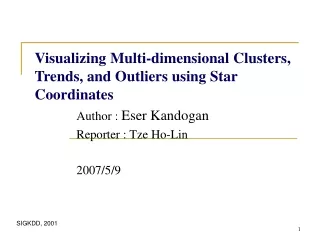
Visualizing Multi-dimensional Clusters, Trends, and Outliers using Star Coordinates Author : Eser Kandogan Reporter : Tze Ho-Lin 2007/5/9 SIGKDD, 2001
Outline • Motivation • Objectives • Methodology: Star Coordinates • Interaction techniques • Evaluation • Conclusion • Personal Comments
Motivation • Real datasets contain typically more than three attributes of data, representing and making sense of multi-dimensional data has been challenging.
Objectives • The objective for this paper is to relieve the dimensionality curse on knowledge discovery through simple data representations that are derived from familiar and easy to understand lower dimensional representations.
Methodology j: 資料點 i: 屬性
Interaction techniques • Scaling • Rotation • Marking • Range Selection • Histogram • Footprints • Sticks
Conclusion • Star Coordinates, aims to let a representation of the higher dimensional space built on the well-known simple representations and also through dynamic interactions that allow users to discover trends, outliers, and clusters easily.
Personal Comments • Application • Data visualization • Advantage • Simple & Easy to understand • Disadvantage • The figures in this paper is rough.
Evaluation - Figure 14 Figure 14. Data point distribution after removing state, area code, phone number, and total minute and calls for day, evening, night, and international calls.
Evaluation - Figure 15 Figure 15. Data point partitioned into four clusters based on international service plan and voice plan membership.
Evaluation - Figure 16 Figure 16. Total day charge and number of customer service calls play the most significant role in churn for customers without international and voice mail service plans‧.