U.S. Census Overview
U.S. Census Overview. SOC 101. Outline of Presentation. Census History Census Questionnaire Census Geography Census Data American FactFinder. Census History. Survey of the United States population every 10 years Mandated by Constitution

U.S. Census Overview
E N D
Presentation Transcript
U.S. Census Overview SOC 101
Outline of Presentation • Census History • Census Questionnaire • Census Geography • Census Data • American FactFinder
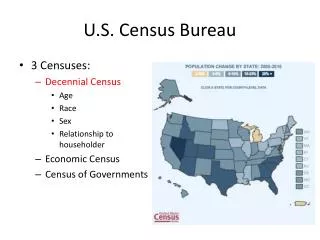
Census History • Survey of the United States population every 10 years • Mandated by Constitution • Purpose: reapportionment of 435 seats in the House of Representatives
Census Questions Vary Over Time • Total population, race, sex in 1790 (650 enumerators counted 3,929,214 people at a cost of $44,337) • Physical and Mental Disabilities in 1830 • Income first asked in 1940 • Televisions surveyed, 1950-70 • Detailed ancestry beginning 1980 • Multiple races and grandparents as caregivers in 2000 (500,000 enumerators counted 281,421,906 people at a cost of $4.5 billion)
Census Questions Vary Over Time • Reflects changes in society • In 1990 and 2000 Congress wanted to reduce paperwork • Grid of questions, 1790-2000 http://www.lib.umich.edu/govdocs/census2/censubj.pdf
Practical Applications for Census Data • Public health professionals identify vulnerable populations for chronic disease • Urban planners identify zoning, housing, sewage, and transportation issues • Social workers conduct needs assessments for services to the elderly, poor, children
Practical Applications for Census Data • Marketers target likely buyers • Politicians use the census to determine voting districts and to assess constituent interests • Environmentalists map the spread of toxic effluents and population densities
Practical Applications for Census Data • Occupation by age, race, and sex for equal employment opportunity • Librarians base collection development policy on community characteristics • Mayors use numbers to apply for federal grants. • Undercount costs money • Identify communities of interest or need CENSUS 2000 SHORT FORM (SF1)HISPANICS AS A PERCENT OF TOTAL POPULATION
2000 Questionnaires100% and Sample 100% Questionnaire • Age • Sex • Race (Multiple) • Hispanic origin • Household relationship • Occupied v. vacant housing units • Owner v. renter occupied housing
Primary Uses of Short Form Data • Race and sex for single years of age to 99; three groups after 100 • Most detail by race (250 groups total)
Race Groups in 2000 • White • Black or African-American • American Indian or Alaskan Native • Asian • Hawaiian or Pacific Islander • Other • Two or More Races • (Based on Self-Identification)
Household Relationships Relationship to Householder • Spouse • Child • Stepchild • Grandchild • Brother/Sister • Parent • Non-relative • Unmarried partner is separate category
2000 Sample Questionnaire(generally 1/6 of population) • Marital status, housing value and rent (100% in 1990) • Grandparents as caregivers (new) • Ancestry • Language • Country of origin • School enrollment and educational attainment (and dropouts)
2000 Sample Questionnaire • Employment • Industry and occupation • Transportation to and place of work • Disability and mental illness • Veteran status • Income and poverty
American Community Survey (ACS) • Started in 1996 to address 2-3 year lag in availability of decennial census data • Annual sample of 3,000,000 households (long form) • Decennial census will still be conducted, but will only include short form • Will enhance the usefulness of the census for planning efforts • Some concerns about sampling error and undercounts • Between 1940 and 2000 the undercount of African Americans was much greater than non-African Americans • Men also tend to be undercounted more than women
Census Geography This diagram shows the hierarchical relationships between geographic types. For example, a line extends from states to counties because a state is comprised of many counties, and a single county can never cross a state boundary.
If no line joins two geographic types, then an absolute and predictable relationship does not exist between them. For example, many places are confined to one county. However, some places extend over more than one county, such as New York City. Therefore, an absolute hierarchical relationship does not exist between counties and places, and any tabulation involving both these geographic types may represent only a part of one county or one place. Census Geography
Census Geography Notice that many lines radiate from blocks, indicating that most geographic types can be described as a collection of blocks, the smallest geographic unit for which the Census Bureau reports data. However, only two of these lines also describe the path by which a block is uniquely named. That is, the path through the Block Group.
Urban Areas • Urbanized = Densely settled area, 50,000+ • Urban Cluster = Densely settled area, • 2500-50,000; can be outside metro area
Metropolitan Statistical Area • Central city of 50,000 or more • Its own county, and • Surrounding counties with heavy commuting patterns • Entire counties belong to MSAs
MSA Definitions • This is very complicated • Just consult the definitions when you need them • http://www.census.gov/population/www/estimates/metrodef.html
Census Tracts • Areas of about 4000 people • Approximate neighborhoods
Block Group Two – eight block groups per tract Smallest area for sample data
Census Data Sources • American FactFinder • http://factfinder.census.gov/ • A web-based tool developed by the Census Bureau to provide census data on the Web • Will probably suffice for all but the most complex analyses • Provides useful first glance at the data before you construct your own analysis
Sources • U.S. Census Bureau • http://www.census.gov • American FactFinder • http://factfinder.census.gov/ • Census Toolkit • http://www.lib.umich.edu/govdocs/census2/centool.pdf • Census Tutorials • Numeric and Spatial Data Services Library, University of Michigan • http://www.lib.umich.edu/nsds/ • Community and Regional Planning Program of The University of Texas at Austin School of Architecture, “Working with 2000 Census Data in ArcGIS,” • http://mather.ar.utexas.edu/Courses/parmenter/gis/arcgis_tips/census2000/index.html • Peters, A. and H. MacDonald. 2004. Unlocking the Census with GIS. ESRI Press. Redlands, CA.