Download

1 / 10
100 likes | 275 Views
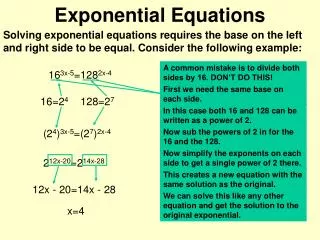
Applications of Exponential and Power Equations. Lesson 5.4. You may have noticed that many equations can be solved by undoing the order of operations. This strategy also applies for more complex power equations that arise in real-world problems. EXAMPLE A.

E N D
You may have noticed that many equations can be solved by undoing the order of operations. • This strategy also applies for more complex power equations that arise in real-world problems.
EXAMPLE A • Rita wants to deposit $500 into a savings account so that its doubling time will be 8 years. What annual percentage rate is necessary for this to happen? (Assume the interest on the account is compounded annually.) Rita will need to find an account with an annual percentage rate of approximately 9.05%.
When an exponential graph models decay, the graph approaches the horizontal axis as x gets very large. • When the context is growth, the graph approaches the horizontal axis as x gets increasingly negative. A horizontal line through any long-run value is called a horizontal asymptote.
Example B • A motion sensor is used to measure the distance between itself and a swinging pendulum. A table records the greatest distance for every tenth swing. At rest, the pendulum hangs 1.25 m from the motion sensor. Find an equation that models the data in the table below.
Plot these data. The graph shows a curved shape, so the data are not linear. As the pendulum slows, the greatest distance approaches a long-run value of 1.25 m. The graph appears to have a horizontal asymptote at y=1.25. The pattern looks like a shifted decreasing geometric sequence, so an exponential decay equation is a good choice for the best model.
An exponential decay function in point-ratio form, , has the horizontal asymptote y=0. • Because these data approach long-run value of 1.25, the exponential function must be translated up 1.25 units. To do so, replace y with y -1.25. The coefficient, y1, is also a y-value, so you must also replace y1 with y1- 1.25 in order to account for the translation.
To find the value of b, select one point for (x1, y1) and a second point (not too close) for (x, y). • If you choose (10, 1.97) and (50, 1.36) you will find
So a model for this data is y =1.25 + 0.72(0.9451)x-10 . Using different pairs of points will generate different values for b, but all of the values should be similar. • Graph the model to check whether the points chosen here resulted in a good-fitting model.