Download
1 / 86
870 likes | 996 Views
ACT Preparation for Science Reasoning. Andra Meredith. WHY are YOU here??. Have you taken the ACT at least once? Are you trying to improve your score? Is someone forcing you to do this? Do you want to know what to expect? Is Science your weakest area? Do you even like SCIENCE?.

E N D
ACT Preparation forScience Reasoning Andra Meredith
WHY are YOU here?? Have you taken the ACT at least once? Are you trying to improve your score? Is someone forcing you to do this? Do you want to know what to expect? Is Science your weakest area? Do you even like SCIENCE?
How I can Help We will meet four times. During this time, we will focus on the format of the test, the types of questions, time restraints, and the basic background information you will need to be ………………READY!!
You will be ready … IF YOU
Show up every week on time • Stay until the end • Pay attention and take part
Our Schedule • 6:00 – 6:30 - Introduction/ Review • 6:30 – 7:15 - Notes • 7:15 – 7:30 - BREAK • 7:30 – 8:30 - Practice tests I: Data analysis II: Research summaries III: Conflicting Hypotheses IV: A complete test
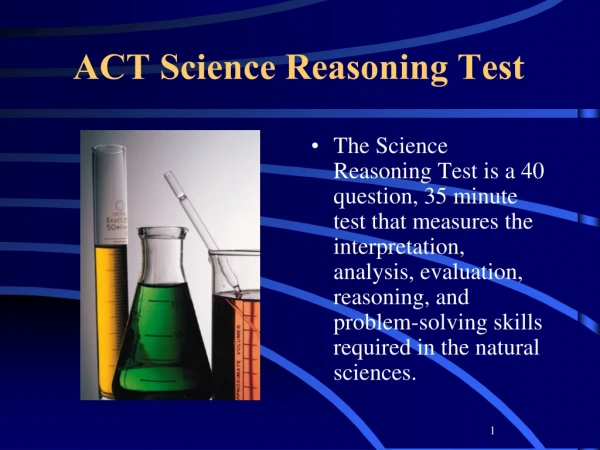
Science Reasoning Don’t let it SCARE you….. You don’t need to know very much information about the topics which includes Biology, Chemistry, Physics, Meteorology, Geology, and Astronomy. You need to FOCUS on reading Carefully and Thinking Logically. Everything you need to know in order to answer the questions will be given to you in the passages.
Science Reasoning • Is not testing knowledge of scientific facts • Is testing your ability to solve puzzles, read graphs and charts, draw conclusions and inferences by working with facts, evidence, and data.
Science Reasoning Three types of questions: • Understanding: tests your ability to know what the passage is saying • Analysis: asks you to find the deeper meanings in the passage • Generalization: Inferences
You have 35 minutes • To read 7 passages, look at charts and graphs, and answer 40 questions….. • That is 5 minutes per passage and obviously less than a minute per question.. HOW??
Test Taking Strategies • Start by scanning the passage. This should take no more than 20 seconds. Just get a “rough” idea of what it is about. Do not study DETAILS. Look for the MAIN message of the graph/ chart. • Read the passage again in order to really understand it. Underline any key words.
Test Taking Strategies 3. Answer the first question in the group. It is an understanding question (the simplest of the 3 types). If you can’t answer it, you’ll probably miss the rest too. Look back in the passage to find the answer. If you still can’t answer it, skip to the next passage and come back to this one later.
Test Taking Strategies • Skip the hard questions. After you have answered the first question. Do not spend more than 30 seconds on any question. Every question is worth the same number of points….go for the easy ones first… BUT…never leave a question blank even if you take a guess
Test Taking Strategies • Read all the choices. Choosing the right answer is eliminating the three wrong answers.. Process of elimination (P.O.E.)- cross off incorrect answers as you go; this will decrease the number of choices when you aren’t sure of the answer
Test Taking Strategies • Use Estimation when asked to calculate. You can also use process of elimination.
Test Taking Strategies • Pace yourself. 35 minutes for 7 passages 5 minutes per passage You have about 30 seconds for each question.
Test Taking Strategies • Answer every question. When you answer the easy questions, try the hard ones again without spending too much time. When your time is running out with only a 30 seconds or so left, take a random guess on the answer sheet.
Difficulty of the questions For each passage, after you have scanned and then read it….answer the first one. If it is too hard even after looking for the answer, skip to the next passage. When you answer the first question, read through all of the questions answering the easiest “understanding” questions first.
Difficulty of the questions • Never leave a question blank before you move on to the next passage • There is no penalty for guessing • It is difficult to come back to a question once you start a new passage because you’ll need to reacquaint yourself with the passage. It is better to at least take a guess the first time through.
Data Representation • Includes information (data) presented on some sort of chart or graph • You will analyze the data in order to answer the questions. • You must understand what the variables are. • Pay attention to chart notes, which will provide essential information that you need to interpret the data in the chart or graph.
Data Representation A little background knowledge will be helpful here. Variable – what changes in an experiment Independent variable – what the experiment is changing Dependent variable – the change being measured as the independent variable changes
Data Representation Line graphs show how something changes (usually over time) Useful for identifying increases or decreases in data Look for main message of graph Watch for changes over time. Be aware of the relationship between the variables.
Data Representation Bar graphs – used to show similarities and differences between data sets. Can be set up horizontally or vertically A scale is used to show comparisons Look for main message through the trend in the graph
Data Representation Tables – show exact values Can be used to show quantitative(numbers) data And Qualitative data such as characteristics Try to identify the relationships between data sets
Data Representation Ask yourself these four questions: • What are the units of measure? • What are the values of the variables? • Are there any trends? • Are there any correlations?
Data Representation • Do you remember the metric system? Kilo, hecta, Deka, base unit, deci, centi, milli • Make sure you know what measurement the chart or graph is using…question may require you to convert. • On a graph the x axis is usually the independent variable and the y axis is the dependent variable. • Direct and indirect correlation? • Inversely proportionate?
Data Representation Barron’s ACT 16th edition Pages 388 – 393 • What are the units of measure? • What are the values of the variables? • Are there any trends? • Are there any correlations?
Research Summaries A description of 2 or more experiments along with a statement of the results of the experiment. A little background knowledge will be helpful here. Remember the SCIENTIFIC METHOD??
Research Summaries Thinking like a scientist: Requires following a pattern of thinking called the scientific method. If you understand this method, you will have more success on the research summaries portion of the test. There are no test questions specific to the scientific method, but having an understanding of the process will help you answer the questions correctly.
Research Summaries • State the problem • Research (gather information) • Form a hypothesis (an educated guess) • Perform an experiment. (control and variable set up) • Record and analyze Data • State a conclusion. – does not always agree with hypothesis • Repeat the process.
Research Summaries • Form a hypothesis (an educated guess) made before experiment is performed • Experiment – must be at least 2 set ups: Control – does not include what is being tested Experimental – includes variable that is being tested
Research Summaries The results obtained from the experiment must prove or disprove the hypothesis. Rules for most experiments: • Most experiments require a control group • An experiment should not test more than one variable at a time. • An experiment should be unbiased. 4. Only the data from the experiment should be used to make the conclusion.
Research Summaries What is a control? Why must there be a control group? What is a variable? How many variables can be tested in an experiment?
Research Summaries What is a control? An individual or a group participating in an experiment under the same conditions as another group except for the exclusion of one factor Why must there be a control group? To serve as the standard; to have something to compare the experimental group
Research Summaries What is a variable? The changes in an experiment; what is being tested. Independent – causes another value or characteristic to change when it is changed Dependent – the value that changes due to a change in the independent variable How many variables can be tested in an experiment? One
Research Summaries Hypothesis: Plants grow better in the dark. Control group: plant in normal light conditions Experimental group: everything about this setup the same as control except it is placed in the dark. The control group is needed to make the comparison. What is the independent variable? What is the dependent variable?
Research Summaries Let’s practice determining independent and dependent variables.
Research SummariesUnderstand the problem Each description starts with a statement of what the experiment is designed to explore. READ THIS STATEMENT CAREFULLY; Make sure you understand this statement.
Research SummariesUnderstand the design Study the design of the experiment. Underline key words in the description. If there isn’t a diagram, sketch yourself one.
Two experimental designs: • Research of some aspect of natural world – making measurements of some kind; relationship between variables; You should identify the variables. Example: global warming and effect on polar ice (temperature vs rate of melting)
Experiments in which the independent variable is being controlled or adjusted, which will make the dependent variable change. You must understand the variables.
Research Summaries Understand the controls: Precautions taken to eliminate all variables except the independent variable…. Plants must have identical soil, air, water….. Must be genetically identical, etc
Research Summaries Study the results- May be presented in words, a diagram, or in some form of a data table (independent variable on left, dependent variable on right) Look for trends….
Research Summaries Look for flaws such as: Are the controls adequate? Is the conclusion obvious by looking at the data? Are there errors in the experiment? Page 396 – Sample questions