Download
1 / 31
330 likes | 795 Views
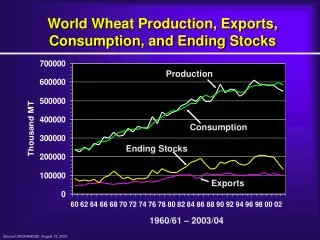
World Wheat Production, Exports, Consumption, and Ending Stocks. Production. Consumption. Ending Stocks. Exports. 1960/61 – 2003/04. Source:USDA/WASDE: August 12, 2003. Foreign Wheat Production, Consumption, Imports, and Ending Stocks. Consumption. Production. Ending Stocks. Imports.

E N D
World Wheat Production, Exports, Consumption, and Ending Stocks Production Consumption Ending Stocks Exports 1960/61 – 2003/04 Source:USDA/WASDE: August 12, 2003
Foreign Wheat Production, Consumption, Imports, and Ending Stocks Consumption Production Ending Stocks Imports 1960/61 – 2003/04 Source:USDA/WASDE: August 12, 2003
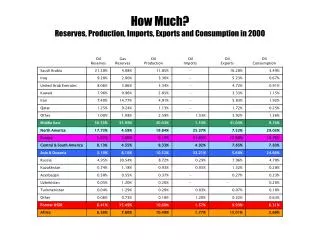
Wheat: Major Producers2002/03 and 2003/04(million metric tons) 2002/03 (estimated) 2003/04 (projected) Total = 563.04 Total = 549.35 Source:USDA/WASDE: August 12, 2003
U.S. Wheat Production, Exports, Consumption, and Ending Stocks Consumption Production Exports Ending Stocks 1965/61 – 2003/04 Source:USDA/WASDE: August 12, 2003
WheatU.S. Supply/Demand(million bushels) Source:USDA/WASDE: August 12, 2003
U.S. Wheat Yield, Planted and Harvested Acreage, 1980 - 2003 Yield Planted Harvested Acres Source:USDA/WASDE: August 12, 2003
Wheat: Area Planted and Harvested, 1996 – 2003(1,000 acres) 1/ Includes area planted in preceding fall Source: WASDE/USDA/NASS
HRW SRW HRS WW Durum Supply Beginning Stks. Production Total Supply 189 1093 1290 55 365 420 145 460 645 75 286 373 28 87 145 Disappearance Domestic Use Exports Total Use Ending Stks. Carryover/Use (%) 491 460 951 339 35.65 261 100 361 59 16.34 236 255 492 153 31.10 106 200 306 67 21.90 85 35 120 25 20.83 2003-2004 U.S. WheatSupply/Demand by Class(million bushels) Source:USDA/WASDE: August 12, 2003
U.S. Wheat Total Imports1982/83 – 2003/04 Source:USDA/WASDE: August 12, 2003
U.S. Domestic Wheat Use1980/82 – 2003/04 Food Use Feed Use Source:USDA/WASDE: August 12, 2003
U.S. Average Prices Received by Farmers for Corn & Wheat, January ‘89 – June 2003 Wheat Corn Source:USDA:
World Wheat Exports2002/03 and 2003/04(million metric tons) 2002/03 (estimated) 2003/04 (projected) Total = 103.46 Total = 97.91 Source:USDA/WASDE: August 12, 2003
Season Average Wheat Price vs. U.S. and World Ending Stocks-to-Use 1969/70 – 2003/04 U.S. Ending Stks. Price World Ending Stks. Source:USDA/WASDE: August 12, 2003
U.S. Wheat Carryover/Use vs. Season Average Price/Loan Rate 1980/81 – 2003/04 89 95 88 96 91 92 90 94 93 97 02 03 81 87 01 86 84 98 82 85 00 99 83 Source:USDA/WASDE: August 12, 2003
Seasonal Price Index for Wheat June 1993 – May 2003 Source:USDA: