Download
1 / 8
80 likes | 198 Views
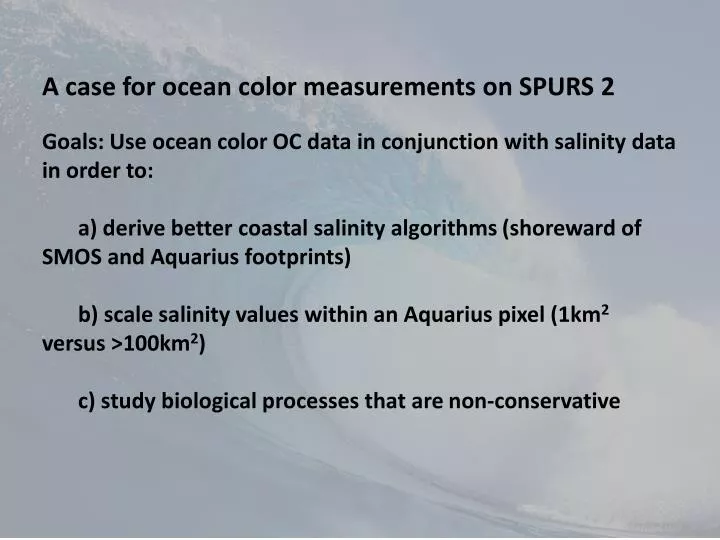
A case for ocean color measurements on SPURS 2 Goals: Use ocean color OC data in conjunction with salinity data in order to : a) derive better coastal salinity algorithms (shoreward of SMOS and Aquarius footprints)

E N D
A case for ocean color measurements on SPURS 2 • Goals: Use ocean color OC data in conjunction with salinity data in order to: • a) derive better coastal salinity algorithms (shoreward of SMOS and Aquarius footprints) • b) scale salinity values within an Aquarius pixel (1km2 versus >100km2) • c) study biological processes that are non-conservative
Why measure ocean color on a salinity campaign? • The dissolved component of colored carbon is conservative with salinity (estimated as absorption of colored dissolved organic matter, CDOM) • Biologic components are subject to mixing and may act as quasi-passive tracers. Eddies are nicely resolved with OC data • Colored materials (dissolved and particulate as mentioned above) are retrievable from ocean color satellite data • Absorption meters are sensitive: could account for Δ< 0.1psu • Fluorescence of CDOM is cost effective, the instruments are small and the power requirements are minimal
Strategy to merge ocean color and salinity data (a coastal example) August 2004 salinity product (Reul et al, 2009) August 2004 MODIS acdm data A merged product can offers much better spatial resolution including “coastal” data. Caution: coefficients relating acdm to salinity change with time and space
Salinity versus absorption Absorption at 413nm at various locations and times in the Gulf of Maine Note varying slopes reflecting endmember qualities
Alory et al, 2012 A reasoned guess for zero end member absorption (412nm) in this pool is ~0.14 m-1. @ 35psu ~0.03. Instrument sensitivity = 0.003 m-1
Looking for a team to adopt UNH for SPURS-2 • We can provide multispectral absorption, attenuation and fluorescence • … interpretation and analysis • joe.salisbury@unh.edu • doug.vandermark@unh.edu