Download
1 / 7
70 likes | 269 Views
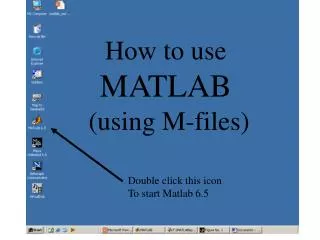
How to use Matlab Analysis and Visualization Software. Paul Harris GCRC Research Skills Workshop May 24, 2002. What is Matlab?.

E N D
How to use Matlab Analysis and Visualization Software Paul Harris GCRC Research Skills Workshop May 24, 2002
What is Matlab? Matlab integrates computing, visualization, and a powerful language to provide a flexible environment for technical computing. The open architecture makes it easy to use MATLAB and its companion products to explore data, create algorithms, and create custom tools that provide early insights and competitive advantages
How much? Base package ~ $500 Toolboxes ~ $200 each OR Use the GCRC Informatics Computer Laboratory (collaboration between GCRC and School of Engineering – all toolboxes)
Webinar Demonstration(2 minutes) http://www.mathworks.com/programs/webex/statcurve/index.shtml?10601 (1:47 – 4:10)
Matlab Demonstrations Visualization – 2D Visualization – 3D Visualization – Visualizing Sound Visualization – Image Colormaps – Bone
GCRC Examples GERD Study – Visualizing Sleep, Computing Statistics for each sleep, pH event. Microneurography QT ECG Analysis ECG Analysis (heart rate versus time) Heart Rate Variability
Call HoneyE-Laryngitis http://www.mathworks.com/programs/webex/statcurve/index.shtml?10601 (1:47 – 4:10)