Download
1 / 27
300 likes | 528 Views
Exploring PPI networks using Cytoscape. EMBO Practical Course Session 8 Nadezhda Doncheva and Piet Molenaar. Course Outline. Lectures & Labs Protein focus Graph context Demo & Do it yourself use cases Data from recent literature Tips & Tricks Biological questions I have a protein

E N D
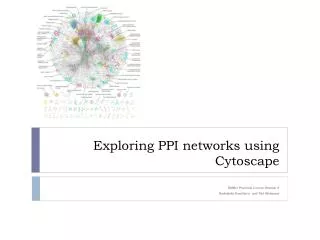
Exploring PPI networks using Cytoscape EMBO Practical Course Session 8 Nadezhda Doncheva and Piet Molenaar
Course Outline • Lectures & Labs • Protein focus • Graph context • Demo & Do it yourself use cases • Data from recent literature • Tips & Tricks • Biological questions • I have a protein • Function, characteristics from known interactions • I have a list of proteins • Shared features, connections • I have data • Derive causal networks • Network • Topology • Hubs • Clusters New hypotheses
Instructor Introductions Nadezhda Doncheva Max Planck Institute for Informatics, Saarbrücken, Germany http://www.mpi-inf.mpg.de/departments/d3 Piet Molenaar AMC Oncogenomics, Amsterdam, The Netherlands piet.amc@gmail.com http://humangenetics-amc.nl/ Network visualization and analysis using Cytoscape Developing Cytoscape plugins in Java Member of Cytoscape dev-team Graph analysis using Cytoscape Developed Cytoscape core plugin Aidan Budd Computational Biologist, Gibson Team, EMBL Heidelberg http://www.embl.de/~budd/ Course coordinator/organizer
Overview Introduction • Part I: Introduction to molecular networks and graph concepts • What are molecular networks? • Why are they useful? • What tools are available? • Part II: Introduction to Cytoscape • Network visualization • Plugins/Apps • Workflows
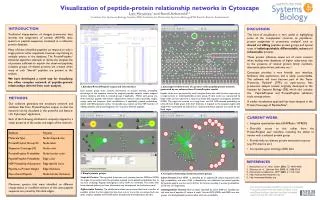
Why networks? • Complex systems are better described as networks of interacting components • The topology of a network characterizes the underlying complex system (global topology parameters) and its individual components (local topology parameters) • Network topology parameters are easily compared • Useful for discovering patterns in large data sets (better than tables in Excel) • Allow the integration of multiple data types
Biological networks • Nodes can represent proteins, genes, metabolites, etc. • Edges can be physical or functional interactions like • Protein-Protein interactions • Protein-DNA interactions • Metabolic interactions • Co-expression relations • Genetic interactions • … • Important to understand what the nodes and edges mean
Applications of network biology • Gene function prediction based on connections to sets of genes/proteins involved in same biological process • Detection of protein complexes by analyzing modularity and higher order organization (motifs, feedback loops) • Identification of disease subnetworks that are transcriptionally active in a disease ”What do you want to do with your network?”
Network visualization • Network layouts • Force-directed: nodes repel and edges pull • Hierarchical: for tree-like networks • Manually adjust layout • Visually interpret a network • Global relationships • Dense clusters
Visual features • Node and edge attributes represent e.g. gene or interaction attributes • Map attributes to node and edge visual properties like color, shape or size
Common network analysis tasks • Network topology statistics such as node degree, betweenness, degree distribution of nodes, clustering coefficient, shortest path between nodes and robustness of the network to the random removal of single nodes. • Modularity refers to the identification of sub-networks of interconnected nodes that might represent molecules physically or functionally linked that work coordinately to achieve a specific function. • Motif analysis is the identification of small network patterns that are over-represented when compared with a randomized version of the same network. Discrete biological processes such as regulatory elements are often composed of such motifs. • Network alignment and comparison tools can identify similarities between networks and have been used to study evolutionary relationships between protein networks of organisms.
Networks as graphs • Formal graph definition: A graph G is a pair of two sets V (nodes) and E (edges): G = (V, E) • Neighbors are two nodes n1 and n2 connected by an edge • Neighborhood is the set of all neighbors of node n • Connectivity knis the size of the neighborhood of n • Degree k is the number of edges incident on n Note that cases exist with k ≠ kn!
Node degree and shortest path • Hub is a node with an exceptionally high degree, larger than the average node degree (see red nodes). • A shortest path between the nodes n and m is a path between n and m of minimal length. • The shortest path length, or distance, between n and m is the length of a shortest path between n and m. • The characteristic path length is the average shortest path length, the expected distance between two connected nodes.
Small-world networks • A network is a small-world network if any two arbitrary nodes are connected by a small number of intermediate edges, i.e. the network has an average shortest path length much smaller than the number of nodes in the network (Watts, Nature, 1998). • Interaction networks have been shown to be small-world networks (Barabási, Nature Reviews in Genetics, 2004)
Scale-free networks • Node degree distribution counts the number of nodes with degree k, for k = 0, 1, 2, … • If the node degree distribution of a network approximates a power law P(k) ~ ak-b with b < 3, the network is scale-free (Barabási, Science, 1999). Many biological networks are scale-free.
Scale-free vs. random networks • Random networks are homogeneous, most nodes have the same number of links) not robust to arbitrary node failure • Scale-free networks have a number of highly connected nodes) robust to random failure, but very sensitive to hub failures • Implications to the robustness of PPI networks (Jeong, Nature, 2001)
Clustering coefficient • The clustering coefficient of a node n is a ratio N=M, where N is the number of edges between the neighbors of a node n, and M is the maximum number of edges that could possibly exist between the neighbors of n. • The network clustering coefficient is the average of the clustering coefficients for all nodes in the network.
Network clustering • Find subsets of nodes, modules or clusters, that satisfy some pre-defined quality measure • Benefits • Finding “natural” clusters • Classifying the data • Detecting outliers • Reducing the data • Downsides • Real data very rarely presents a unique clustering • Many different models try out more than one • Several alternative solutions could exist • Interpretation of clusters
Motifs • A small connected graph with a given number of nodes • Motif frequency is the number of different matches of a motif • Functionally relevant motifs in biological networks: • Feed-forward loop (1) • Bifan motif (2) • Single-input motif (3) • Multi-input motif (4) • Significance profiles of motifs 2. 1. 3. 4.
Network organization The levels of organization of complex networks: • Node degreeprovides information about single nodes • Three or more nodes represent a motif • Larger groups of nodes are called modules or communities • Hierarchydescribes how the various structural elements are combined
Available software tools • Cytoscape http://cytoscape.org/ • BioLayout Express3D http://www.biolayout.org/ • VisANT http://visant.bu.edu/ • Ondex http://www.ondex.org/ • Pajek http://pajek.imfm.si/ • Ingenuity Pathway Analysis http://www.ingenuity.com/products/pathways_analysis.html • Pathway Studio http://www.ariadnegenomics.com/products/pathway-studio/
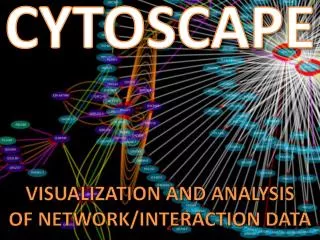
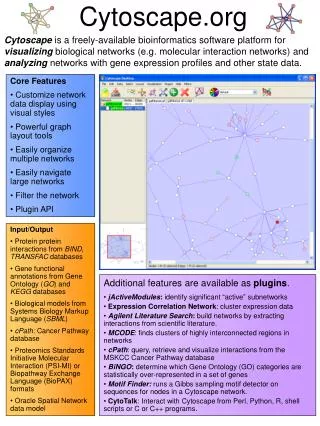
Why Cytoscape? • Visualization, Integration & Analysis • Free & open source software application (LGPL license) • Written in Java: can run on Windows, Mac, & Linux • Developed by a consortium: UCSD, ISB, Agilent, MSKCC, Pasteur, UCSF, Unilever, Utoronto; provide a permanent dedicated team of developers • Active community: mailing lists, annual conferences • 10,000s users, 3000 downloads/month • Extensible through plugins developed by third parties • It is used! Lots of citations www.cytoscape.org
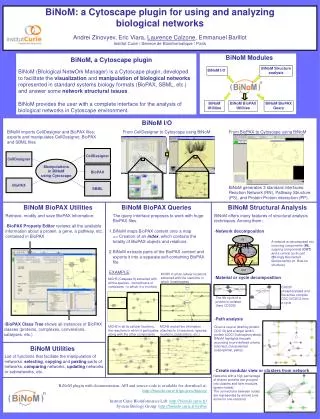
Cytoscape extended functionality • Cytoscape extends its functionality with plugins or apps • Developed by third parties • Listed at http://apps.cytoscape.org/ • Usually available through the Plugin Manager • Can be downloaded from the plugins’s websites • Cover many diverse areas of application
A typical Cytoscape workflow • Load networks • Load attributes • Analyze and visualize networks • Prepare for publication Cline, et al. ”Integration of biological networks and gene expression data using Cytoscape”, Nature Protocols, 2, 2366-2382 (2007).
Some useful Cytoscape links • Download: http://www.cytoscape.org/download.html • Tutorials: http://opentutorials.cgl.ucsf.edu/index.php/Portal:Cytoscape • Cytoscape Mailing lists: http://www.cytoscape.org/community.html • Plugins/Apps: http://apps.cytoscape.org/ • Documentation: http://www.cytoscape.org/documentation_users.html
On to the first Tutorial session • Unless any questions ???