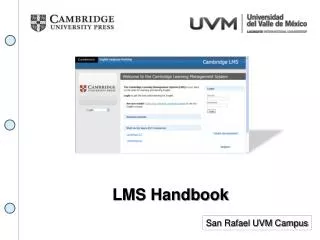
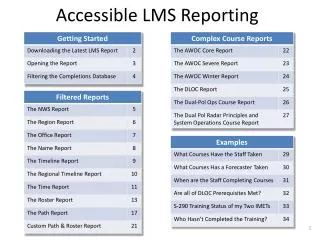
How to Access and Download the Latest LMS Report
This guide outlines the steps to access, filter, and download the latest Learning Management System (LMS) report. Begin by navigating to the LMS main page and clicking on the "LMS Report" button. If you don't see this option, contact your Regional Training section for assistance. The guide walks you through how to filter the LMS database, apply specific report criteria, and view generating reports. Detailed explanations of various report types (NWS, Region, Office, Name, and Timeline Reports) are included, helping users effectively manage and analyze training completions.

How to Access and Download the Latest LMS Report
E N D
Presentation Transcript
Downloading the Latest LMS Report • Go to your LMS main page. • On the front page click the “LMS Report” button • If you need access to this reporting system and don’t see this button, contact your Regional training section. They will forward the request to Mark.L.Sessing@noaa.gov here at WDTB. • When the file requestor appears, you can save or open the file: • Save this spreadsheet in a local directory.
Opening the Report • Double-click on the LMSReport spreadsheet file. • The spreadsheet will load and display the Request sheet. • This Request sheet is made up of four parts: • The Filter section allows to select potions of the training database. • The Reports section generates different reports using the current filters. • The Admin section is used by WDTB to ingest and clean up the training database. You don’t need to access this section. • The Request tab allows you to jump back from a report page to this Request sheet.
Filtering the Completions Database An unfiltered LMS Database has close to 200,000 training completions. Your reports often deal with only a subset of this database. When no filters are specified, you select the entire data base. You can specify up to 8 different types of filters. If you specify more than one filter, all filters must be met to be included. Filters are case insensitive. Filters don’t not have to be exact matches. If any the text of a filter appears anywhere in the field, you will get a match. • In this example, three filters are applied to the LMS Reports database: • Course titles that have the phrase “no fear” somewhere in their text. • The staff in Eastern Region • Who completed the course on or after 10/1/10 • After you enter your three filters, press the Apply Filter button. • In this example, there were 655 completions that meet these three filters.
The NWS Report The NWS report displays the filtered NWS completions broken out by course title. In this example, I typed “No Fear” (without quotes) into the Course Filter box, clicked the Apply Filter button, waited for the macro to process, and then clicked the Completions button in the Reports section. The result shows the courses in the LMS that contain the phrase “No Fear”. The pie chart to the right of the totals shows the percentage of completions by course title. If, after reviewing the report result, you want to focus on just one of the listed courses, just copy that name from the spreadsheet, paste it into the Course Filter box, and hit the Apply Filter button.
The Region Report The Region Completions report breaks down the filtered completions totals by region. In this example, I typed “2010 No Fear” (without quotes) into the Course Filter box, clicked the Apply Filter button, waited for the macro to process, and then clicked the Region Completions button in the Reports section. The result shows a regional breakdown of completions of the 2010 No Fear Act Briefing. The pie chart on the left shows the same data that the chart from the NWS button shows (in this case, since only one course was selected, the 2010 No Fear Act Briefing is 100%). The pie chart on the right shows a completion percentage breakdown of each region relative to the total number of completions.
The Office Report The Office Report lists the total number of filtered completions by office. In this example, I typed “2010 No Fear” (without quotes) into the Course Filter box, clicked the Apply Filter button, waited for the macro to process, and then clicked the Office button in the Reports section. The Office report lists an office breakdown of completions of the 2010 No Fear Act Briefing. The data is sorted by the office with the highest number of completions. There is a difference between the number of courses selected using the filter (5067) and the number of courses in the spreadsheet (4766). This is due to persons completing it who have a blank office entry in the LMS. The Show All WFOs button will add WFOs that have zero completions; the Show All Offices button will add all non-WFO offices that have zero completions.
The Name Report The Name report lists the filtered training completion by name and when they completed it. In this example, I typed “2010 No Fear” (without quotes) into the Course Filter box, clicked the Apply Filter button, waited for the macro to process, and then clicked the Name button in the Reports section. The result shows a breakdown of completions of the 2010 No Fear Act Briefing by name with the completion date. The listing is sorted by the last name, first name, an then by course. The last names have been blacked out for this example.
The Timeline Report • The Timeline Report provides two graphs plotting the cumulative number of completions. • The first graph is a 2D chart displaying the total cumulative number of completions as a function of time. • The second graph is a 3D chart displaying the cumulative number of completions by producer as function of time.
The Regional Timeline Report • The Regional Timeline Report is similar to the Timeline Report except the 3D graph is broken out by region. • The first graph is a 2D chart displaying the total cumulative number of completions as a function of time. • The second graph is a 3D chart displaying the cumulative number of completions by region as function of time.
The Time ReportTime of Day • The Time report produces 4 graphs that display completion time of day and day of week. All completions times are normalized to local time. • The first time-of-day graph plots completions by hour. • The second time-of-day graph is a pie chart of completions by shift.
The Time ReportDay of Week • The Time report produces 4 graphs that display completion time of day and day of week. All completions times are normalized to local time. • The first day-of-week graph plots completions by the day of the week (again normalized to local time). • The second day-of-week graph is a pie chart of completions by weekday versus weekend.
Roster Report The Roster report provides a listing of staff on a roster who has not completed a course. You can think of it as a report on “who hasn’t completed the training”. You can define up to 9 different rosters in a separate spreadsheet called LMSReports_Rosters.xlsm (next slide). This powerful reporting capability is not available as part of the delivered LMS reporting system as the LMS doesn’t know who is required to take a course. For example, the delivered LMS reporting system couldn’t possibly understand: Roster 9: All CWSU forecasters.
Roster ReportDownloading the Roster Spreadsheet Click the Report Help and Roster Template button on the LMSReport spreadsheet file or on the front page of your administrative LMS account. On the webpage that opens, click the Roster and Learning Path Spreadsheets (zip file) link. Save the LMSReport_Rosters spreadsheet file in the same directory as the LMSReport file. NOTE: Remember that each time the LMSReport_Rosters spreadsheet is downloaded, it will overwrite the existing file that you have customized.
Roster ReportBuilding Your Rosters You will be entering your rosters into the LMSReport_Rosters.xlsm. You should only download and unzip this file once to establish the template on your PC. After you start populating and saving your rosters, don’t overwrite your work with the template. Click on one of the 9 Roster tabs to start creating your roster. First enter a short label for this roster in the very first cell (i.e. cell A1) Then enter the e-mail name of the staff member in the first column. Entering the “@noaa.gov” portion of the e-mail address is optional. Data may be in upper or lower case. Go back to the first sheet by clicking on the Control tab. Then click on the Update button. Save your updated Roster spreadsheet.
Roster ReportGenerating a Roster Report 1. The Update Roster Titles button will need to be clicked if changes have been made to the Paths spreadsheet and also when a new LMS Report spreadsheet is downloaded from the LMS. Click on the roster spinner to select one of the 9 rosters you defined in LMSReports_Rosters.xlsm. Click on the Roster Report button. The Roster report will be listed with those without completions first. The sorting will be by region, office, and then name. For those with completions, the listing is sorted by number of completions, then region, office and name.
Path Report The Path report provides a listing of any courses you wish to track. Think of it as an office-specific development plan that is not on the LMS. You can define up to 9 different learning paths in a separate spreadsheet called LMSReports_Paths.xlsm (next slide). This powerful reporting capability is not available as part of the delivered LMS reporting system as it is not practical for the LMS to track each office’s site-specific development plans.
Paths ReportDownloading the Paths Spreadsheet Click the Templates and Job Aid button on the LMSReport spreadsheet file. On the webpage that opens, click the Roster and Learning Path Spreadsheets (zip file) link. Save the LMSReport_Paths spreadsheet file in the same directory as the LMSReport file. NOTE: Remember that each time the LMSReport_Paths spreadsheet is downloaded, it will overwrite the existing file that you have customized.
Paths ReportBuilding Your Learning Paths You will be entering your learning paths into the LMSReport_Paths.xlsm. You should only download and unzip this file once to establish the template on your PC. After you start populating and saving your learning paths, don’t overwrite your work with the template. Click on one of the 9 Path tabs to start creating your learning path. First enter a short label for this roster in the very first cell (i.e. cell A1) Then enter the name of each course in the second column and then give each module an abbreviation in the first column. Data may be in upper or lower case. Save your updated Paths spreadsheet.
Paths ReportGenerating a Learning Path Report The Update Path Titles button will need to be clicked if changes have been made to the Paths spreadsheet and also when a new LMS Report spreadsheet is downloaded from the LMS. Click on the path spinner to select one of the 9 rosters you defined in LMSReport_Paths.xlsm. Click on the Path Report button. The report sorting will be by number of lessons in the path that are completed and then by date of last completion.
Custom Path & Roster ReportCombining the Previous Two Topics The Custom Path & Roster Report button does exactly what its name implies. It will combine the features of the Path and Roster reports. To use it, you will need to have already specified the paths and rosters using instructions from the previous slides. Then click on the CustomPath & Roster Report button. In this case, I’m using the roster report I built for the WDTB CIMMS Research Associates and the path report for the Dual-Pol Systems Course. The report sorting will be by number of lessons in the path that are completed and then by date of last completion.
The AWOC Core Report The AWOC CoreReport is generated by clicking the AWOC Core button on the right side of the Reports box. A spreadsheet will appear with a list of the persons enrolled in the course, along with what they are still needing to complete. If a person has completed everything, the “Not Completed” column is blank. We will then send them a certificate of completion and post the date the certificate was sent. To understand the “Not Completed” column, you can check the Display Codes box that is at the bottom of the front page and the legend will appear to the right of the completion list. The report can also be sorted by region or student name by clicking the buttons above the legend.
The AWOC Severe Report The AWOC SevereReport is generated by clicking the AWOC Severe button on the right side of the Reports box. A spreadsheet will appear with a list of the persons enrolled in the course, along with what they are still needing to complete. If a person has completed everything, the “Not Completed” column is blank. We will then send them a certificate of completion and post the date the certificate was sent. To understand the “Not Completed” column, you can check the Display Codes box that is at the bottom of the front page and the legend will appear to the right of the completion list. The report can also be sorted by region or student name by clicking the buttons above the legend.
The AWOC Winter Report The AWOC WinterReport is generated by clicking the AWOC Winter button on the right side of the Reports box. A spreadsheet will appear with a list of the persons enrolled in the course, along with what they are still needing to complete. If a person has completed everything, the “Not Completed” column is blank. We will then send them a certificate of completion and post the date the certificate was sent. To understand the “Not Completed” column, you can check the Display Codes box that is at the bottom of the front page and the legend will appear to the right of the completion list. The report can also be sorted by region or student name by clicking the buttons above the legend.
The DLOC Report The DLOCReport is generated by clicking the DLOC button on the right side of the Reports box. A spreadsheet will appear with a list of the persons enrolled in the course, along with what they are still needing to complete. If a person has completed everything, the “Not Completed” column is blank. We will then send them a certificate of completion and post the date the certificate was sent. To understand the “Not Completed” column, you can check the Display Codes box that is at the bottom of the front page and the legend will appear to the right of the completion list. The report can also be sorted by region, student name, lead instructor, or workshop by clicking the buttons above the legend.
The Dual Pol Ops Course Report The report for the Dual Pol Operations Course is generated by clicking the Dual Pol Ops button on the right side of the Reports box. A spreadsheet will appear with a list of the persons enrolled in the course, along with what they are still needing to complete. If a person has completed everything, the “Not Completed” column is blank. We will then send them a certificate of completion and post the date the certificate was sent. To understand the “Not Completed” column, you can check the Display Codes box that is at the bottom of the front page and the legend will appear to the right of the completion list. The report can also be sorted by region or student name by clicking the buttons above the legend. You will notice there are many people who have 2W in the Not Completed column. We are requiring that any two of the four WES simulations be completed in order for this plan to be complete.
The Dual Pol Radar Principles and System Operations Course Report The report for the Dual Pol Radar Principles and System Operations Course is generated by clicking the Dual PolSystem button on the right side of the Reports box. A spreadsheet will appear with a list of the persons enrolled in the course, along with what they are still needing to complete. If a person has completed everything, the “Not Completed” column is blank. We will then send them a certificate of completion and post the date the certificate was sent. To understand the “Not Completed” column, you can check the Display Codes box that is at the bottom of the front page and the legend will appear to the right of the completion list. The report can also be sorted by region or student name by clicking the buttons above the legend.
Special Feature for Dual Pol Reporting The reports for both the the Dual Pol Operations Course and the Dual Pol Advanced Operations Course can be customized for your office or region by entering your office or region into the filter box and then clicking whichever dual pol report you wish to run. The Apply Filter button does not have to be clicked for this feature. The resulting spreadsheet that appears will show the list of people within your office or region that are taking the dual pol training.
Example:What Courses Have the Staff Taken Scenario: The Buffalo MIC wants to know what courses the office staff have completed since the beginning of the fiscal year. Set up your office filter and date filter. Press the Completions report button. The report lists all the courses taken for your office during this time… sorted by the number of completions. The report also generates a pie chart of the top 10 courses completed for your office during this time.
Example:What Courses Has a Forecaster Taken Scenario: The Norman MIC wants to know what courses Marc Austin has completed since his midterm. When did he complete these courses? Set up your office filter, name filter, and date filter and click on the Apply Filter button. Press the Name report button. The report lists all the courses taken for the forecaster and the date of completion. The report is sorted by Course name.
Example:When are the Staff Completing Courses • Scenario: The Buffalo MIC is trying to determine if they should implement a “Training Shift”. Over the past year, when is the staff completing LMS courses? • Set up your office filter, and date filter and click on the Apply Filter button. • Press the Time report button. • The report generates 4 LMS completion graphs: • by Time of day • By Shift • By Day of Week • By Weekday/Weekends
Example:Are all of DLOC Prerequisites Met? • Scenario: Your intern is enrolled in DLOC and will be attending the workshop portion in two weeks. Has the intern completed all the needed workshop prerequisites ? • There are no need to filter the LMS database. All complex courses, such as DLOC, are based on WDTB enrollments. • Press the DLOC report button. • The report provides a list of DLOC modules the forecaster stills needs to complete prior to attending the DLOC workshop. • You can click on the sort by “Region/Office” or by “Student” to change how the report is sorted. • If you want to see the course names associated with these ID, make sure “Display Codes” is selected when you request the report.
Example:S-290 Training Status of my Two IMETs Scenario: You have two staff members assigned IMET responsibilities. What is their S-290 training status? Set up your Course and Office filters. Click on the Apply Filter button. Press the Name report button. The report provides a list of all S-290 Course completions by forecaster.
Example:Who Hasn’t Completed the No Fear Act Training? (page 1) • Scenario: WDTB has been directed to provide the names its staff who has not completed the 2010 No Fear Act training on a weekly basis. All WDTB staff must complete this training over the next three weeks. • This is a “Who hasn’t completed…” requirements, so we will be using the Roster Reportfeature. • The first thing we will do is to set up our roster to include all WDTB staff. • Open your roster definitions spreadsheet, LMSReport_Rosters.xlsm. If you don’t yet have this spreadsheet template you can hit the help button on the opening Request tab. • We’ll define our roster on the tab labeled Roster1. In cell A1 we’ll enter the roster label (in this case “WDTB All Staff’).
Example:Who Hasn’t Completed the No Fear Act Training? (page 2) • Now, in column A, we’ll enter the e-mail names of the staff on this roster. Note we can optionally include the “@noaa.gov” portion of the e-mail name. • Go back to the Control tab (i.e. the first tab) and click on the Update button. • The update Roster1 now has all the information needed. • Save and thenexit this rosterspreadsheet.
Example:Who Hasn’t Completed the No Fear Act Training? (page 3) • Now that we have our new roster defined we’ll open our main reporting spreadsheet. Lets set up our course name filter and hit the Apply button. 5056 completions so far in the NWS. • Now we will apply this group of completions against your roster. As this is a new roster we will click on the Update Roster Titles. Then we’ll click on the spinner to select the roster labeled “[1] WDTB all Staff” • With our filtered completions and our defined roster selected, press the Roster Report button to generate your report. • Non-completions are listed first. In there is one WDTB staff member that has to complete the course in the next three weeks. • Staff with completions are listed next.