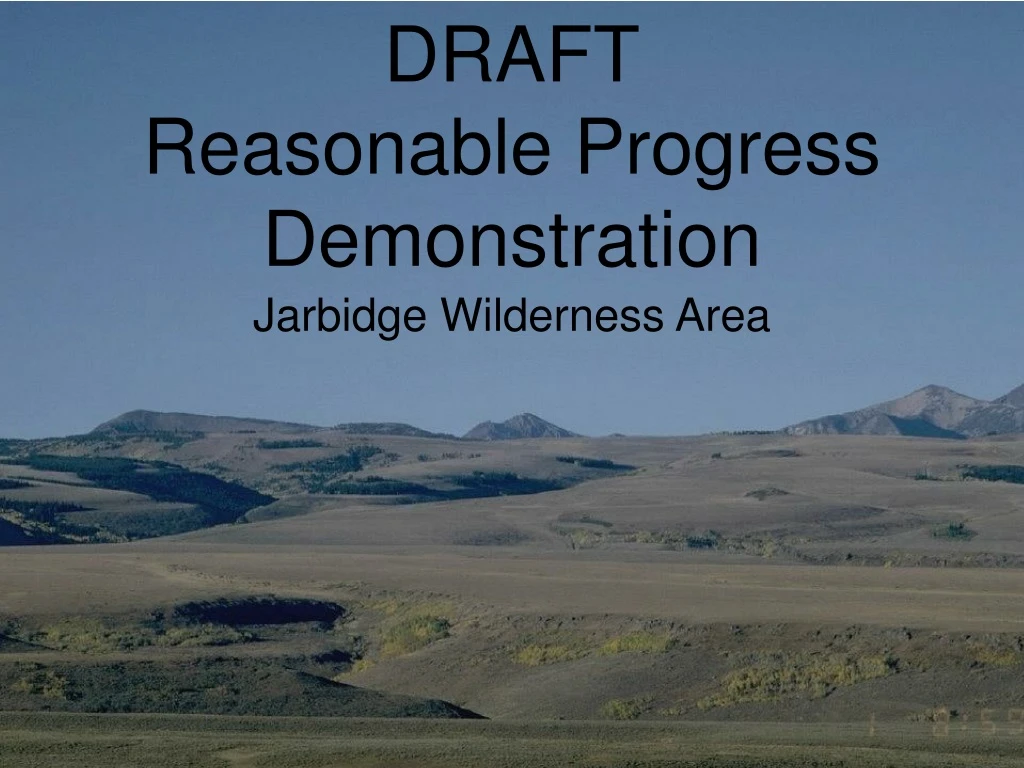

DRAFT Reasonable Progress Demonstration
E N D
Presentation Transcript
DRAFTReasonable Progress Demonstration Jarbidge Wilderness Area
Speciated Extinction Budget and Glidepaths for Jarbidge Wilderness Area
Jarbidge WA Species Trends and URP Glidepath – 20% Best Days Source: TSS \ Resources \ Monitoring Data \ Natural Conditions II
Jarbidge WA Species Trends and URP Glidepath – 20% Worst Days Source: TSS \ Resources \ Monitoring Data \ Natural Conditions II
Contributions to Visibility Impairment at Jarbidge Wilderness Area based on PSAT Results
Source: Chart made from spreadsheets posted at: WRAP Technical Support System>>Resources>>Monitoring>>Composition
Source: Chart made from spreadsheets posted at: WRAP Technical Support System>>Resources>>Monitoring>>Composition
2018 SOx WEP Results and Residence Time Plot check map against TSS
SOx Emissions from Nevada and Adjacent States
Nevada Sulfate Contributions to Visibility Impairment at Class I Areas in Adjacent States
Grand Canyon NP (GRCA2) – PSAT Modeling for SP4 (sulfate)Nevada Sulfate Impact on Best Days: 2002 = 1.6%; 2018 = 1.4%Nevada Sulfate Impact on Worst Days: 2002 = 3.1%; 2018 = 1.3%
Death Valley NP (DEVA1) – PSAT Modeling for SP4 (sulfate)Nevada Sulfate Impact on Best Days: 2002 = 4.4%; 2018 = 4.2%Nevada Sulfate Impact on Worst Days: 2002 = 1.8%; 2018 = 1.3%
Desolation Wilderness (BLIS1) – PSAT Modeling for SP4 (sulfate)Nevada Sulfate Impact on Best Days: 2002 = 1.6%; 2018 = 1.6%Nevada Sulfate Impact on Worst Days: 2002 = 2.5%; 2018 = 2.2%
Hoover Wilderness (HOOV1) – PSAT Modeling for SP4 (sulfate)Nevada Sulfate Impact on Best Days: 2002 = 1.2%; 2018 = 1.0%Nevada Sulfate Impact on Worst Days: 2002 = 1.5%; 2018 = 1.4%
Lassen Volcanic NP (LAVO1) – PSAT Modeling for SP4 (sulfate)Nevada Sulfate Impact on Best Days: 2002 = 1.5%; 2018 = 1.4%Nevada Sulfate Impact on Worst Days: 2002 = 1.0%; 2018 = 1.0%
San Gorgonio W (SAGO1) – PSAT Modeling for SP4 (sulfate)Nevada Sulfate Impact on Best Days: 2002 = 3.5%; 2018 = 2.0%Nevada Sulfate Impact on Worst Days: 2002 = 0.8%; 2018 = 0.4%
Craters of the Moon NM (CRMO1) – PSAT Modeling for SP4 (sulfate)Nevada Sulfate Impact on Best Days: 2002 = 2.0%; 2018 = 1.8%Nevada Sulfate Impact on Worst Days: 2002 = 0.9%; 2018 = 0.8%
Zion NP (Zion1) – PSAT Modeling for SP4 (sulfate)Nevada Sulfate Impact on Best Days: 2002 = 5.6% (3rd); 2018 = 5.0% (3rd)Nevada Sulfate Impact on Worst Days: 2002 = 8.9% (4th); 2018 = 5.6% (6th)