Sustainable Living Guide for Eco-Friendly Choices
350 likes | 418 Views
Learn how human activities alter essential nutrient cycles and impact ecosystems. Explore the effects on water, carbon, nitrogen, ozone, phosphorus, and sulfur cycles. Discover practical tips to reduce your ecological footprint, such as biking to work, buying energy-efficient appliances, and supporting local food sources.

Sustainable Living Guide for Eco-Friendly Choices
E N D
Presentation Transcript
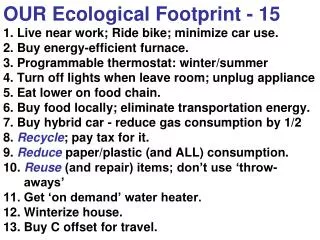
OUR Ecological Footprint - 151. Live near work; Ride bike; minimize car use.2. Buy energy-efficient furnace.3. Programmable thermostat: winter/summer4.Turn off lights when leave room; unplug appliance5. Eat lower on food chain.6. Buy food locally; eliminate transportation energy.7. Buy hybrid car - reduce gas consumption by 1/28. Recycle; pay tax for it.9. Reduce paper/plastic (and ALL) consumption.10. Reuse (and repair) items; don’t use ‘throw- aways’11. Get ‘on demand’ water heater.12. Winterize house.13. Buy C offset for travel.
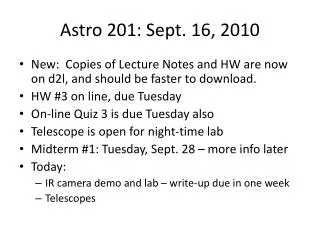
…for Tuesday Go to: www.worldchanging.com Select one article, read it, print first page (only) and bring to lecture. 1 Stuff 5 Business 2 Shelter 6 Politics 3 Cities 7 Planet 4 Community 8 Any of 1-7
OBJECTIVES Human Activities Alter Nutrient Cycles Relates to Intersystem Cycles: Inputs/Outputs disrupted-->consequences Water Carbon Nitrogen Ozone Phosphorus Sulfur
Ecosystem 2 Intersystemcycling: Nutrients gained (input) and lost (output) by an ecosystem Ecosystem 1 Ecosystem 1 2 Input Output Input output
Intersystem cycling -->Input from waterflow
Nutrient inputs on land from: • Lithosphere (weathering of bedrock and soil) • Atmosphere • Wetfall (in precipitation) • Dryfall (particles) • Hydrosphere • Human Activities
Nutrient losses (output) on land to: • Atmosphere • Streams and groundwater • How do human activities alter output?
Global BGC cycles: Water cycle: a physical model * Figure 3 50% of water in the Amazon Basin is internally recycled. Predict how deforestation there might be affecting the hydrologic (water) cycle and the forest.
Figure 6 ***Carbon cycle: What are 2 new fluxes due to human activities? What pools are being altered? The missing C sink
snow intact snow removed
intact removed
How are humans altering the N cycle? • Nitrogen-fixing crops • Fossil fuel burning • Nitrogen fertilizer • Animal feed lots + manure • Invasive species fix N2 • Consequences • greenhouse gases • nitrogen saturation • runoff - aquatic systems + water supply • biodiversity and species mix
Ozone (O3) + UV radiation 1. at surface O2 with NO2 with light --> O3 NO2 from burning gas in cars Ozone = oxidant of organic molecules SOYFACE: elevated O3 lowers crop productivity
2. Ozone in upper atmosphere blocks UV CFCs and creates ‘black hole’
Phosphorus concentration controls the trophic structure and productivity of lakes. CNP CN
Human activities affect input from land to water • runoff/seepage into groundwater/aquifers • agriculture land, especially NPK • animal feedlots, especially N • sewage input, C, N
Human eutrophication (overproduction of organic matter in aquatic systems) is harmful. • Added nutrients stimulate algal GPP, BUT • Too much overwhelms intrasystem regeneration • Increase in organic matter; increased sediments • Energy flows to bacteria, not higher trophic level • Increase in decomposition + use of oxygen • ---> depletes oxygen • ---> kills aerobes, including fish
Consequences for aquatic systems • change freshwater aquatic communities • create ‘dead zones’ in oceans • lower quality of drinking water
pH profoundly affects ecosystems, especially aquatic systems.
Acid rain from coal-burning industries affects forest growth. Slow recovery from its effects…
Effects of acid rain on a forest.Why is damage greater on 1 side of mt.?Why haven’t forests recovered when acid rain was lessened?
The hierarchical nature and processes of different levels of ecological systems:
Our Ecological Footprint How do our life style choices at the individual level impact higher levels of ecological organization? How does a choice impact energy flow and cycling of matter? H2O C N ozone P S